What’s In-Store Customer Journey?
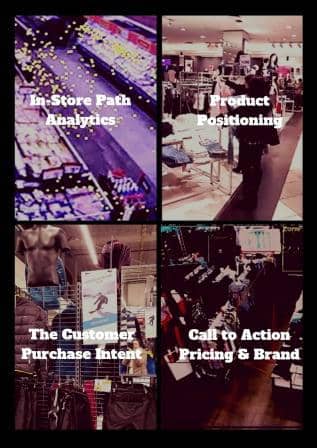
The In-Store Customer Journey is a dynamic map that tracks how people behave in a physical store. The analytics generate actionable insights to increase conversions and optimize profits.
Using case studies as examples, here are projects you can start today:
7 In-Store Customer Journey Examples
- Identify Purchase Points
- Map Path Trajectory
- Quantify Local Demand
- Prevent Friction Points
- Measure Engage Time
- Monitor Service Time
- Optimize Product Positioning
Let’s start with definitions.
What’s In-Store Customer Journey Map?
An in-store customer journey mapping visualizes the shopping funnel from entering a retail store to checkout. In other words, an in-store customer journey map describes the transformation from “visitor” to “buyer.”
What are Actionable Insights for In-Store Customer Journey?
Actionable insights make you rethink the where, what, and why of in-store customer behaviors. The analytics describes the building blocks of the In-Store Path to Purchase.
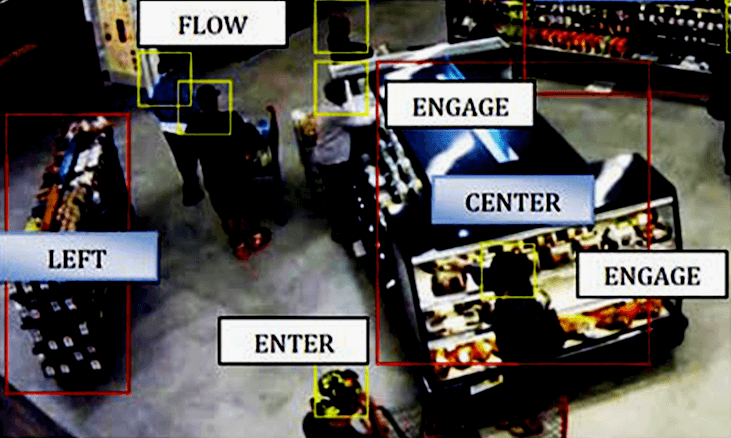
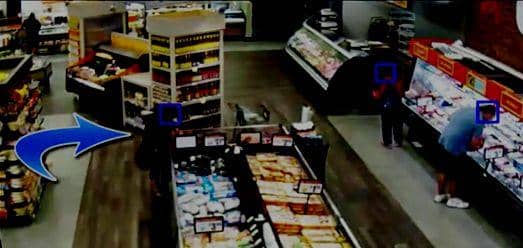
Technically, people-tracking technologies capture objects using detection, recognition, and tracking “people in motion.”
The (anonymous) foot traffic data and object attributes generate actionable metrics for retail stores, shopping malls, and other physical environments.
The in-store customer tracking data includes:
- Location to understand local demand opportunity.
- Time to evaluate the shopper’s “intent to buy.”
- Touchpoints to track in-store customer engagement.
- Attributes to identify visitors and shopping groups.
- Behaviors to manage customer service and improve customer experience.
What are the Steps to Design an In-Store Customer Journey Map?
Contrary to online purchase funnels, the in-store customer journey is dynamic. In other words, the process is not a step-by-step linear sales funnel but robust retail KPIs.
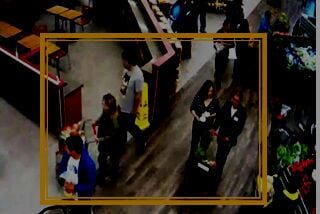
Moreover, the in-store customer journey isn’t only for individuals. In physical stores, you also need to take into consideration the actions of employees and groups.
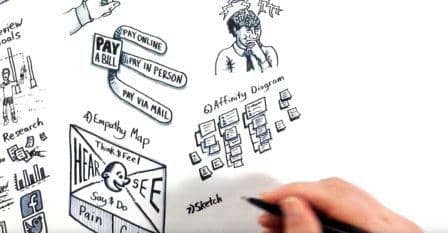
Design the In-Store Customer Journey Step-By-Step
Here’s my process for designing the in-store customer journey:
PEACE Method for Profit
- People: identify customer behaviors
- Engage: measure shopping activity
- Abandon: prevent friction points
- Conversion: Pinpoint the call to action
- External: Optimize retail KPI
The dynamic mapping of customer and staff behaviors will help you understand the transformation from browsing to buying.
But first,
3 Sources of Confusion about the Customer Journey in Retail
The Covid-19 pandemic accelerated the “digital transformation” of physical stores.
People Now Spend More at Amazon Than at Walmart
New York Times
And yet, confusion is prevalent.
For example,
1) Online vs. Offline Shopping Behaviors
Retailers and marketers often talk about “seamless retail analytics.” And yet, to build a customer journey map correctly, you focus on behaviors in physical locations.
There are distinct differences between online and offline shopping.
For example,
Linear vs. Dynamic Maps: Online behaviors are dictated by how people move from webpage to webpage (impressions and clicks). In physical stores, you cannot dictate customer flow. The in-store sales funnel is not linear but dynamic.
Sole vs. Social Visits: Online, people buy for themselves or someone else. As a result, the online sales funnel is for individuals. Physical stores are social. The in-store customer journey should consider the impact of associates and groups.
Conversion vs. Profit Goals: Conversion Rate Optimization (CRO) is a defined discipline for online commerce. CRO exists because digital products are hard to create but easy to duplicate. But physical locations suffer from the multiplier effect. Therefore, in physical stores, the outcome is not conversions or sales but profits.
In summary, you should assume the offline customer’s experience is NOT the same as online shopping behaviors. It reflects on the in-store customer journey.
Our research found that one consequence of the new world of marketing complexity is that more consumers hold off their final purchase decision until they’re in a store.
McKinsey & Company
2) Anonymous Behaviors vs. Personalized Marketing
Another source of confusion is the difference between marketing personalization and the anonymous tracking of in-store customer behaviors.
That’s the difference between location-based marketing and location analytics.
Technically, that’s a data attribution challenge. Data attribution refers to the process of crediting sales and conversations to specific customers and their behaviors.
Here’s what you should know:
Exactly like it sounds,
Location-based marketing is about sending personalized push notifications to consumers based on their geophysical location.
Location Marketing refers to device-based personal trackers that emit location-based data. In other words, devices such as smartphones represent a gateway to individuals.
Location-based marketing requires consumers’ opt-in. And retailers can connect directly only with consumers in their loyalty applications.
But if your focus is the store, the data can be anonymous.
Location Analytics depends on object detection and people-tracking technologies. The data output is anonymous. You don’t need to identify the object (person). You only need to know the object’s location, attributes, and behaviors.
The business benefits include geo-location demand analytics, foot traffic data, and tracking in-store consumer behaviors.
Location analytics is the technical framework beyond in-store optimization.
The goal is not to interact digitally with consumers during their visits to physical stores. The objective is to improve store operations and customer service.
For example,
Customer segmentation and personalization serve different business goals. With segmentation, you design the store. Personalization is about marketing promotions.
Even at the highest levels, retailers don’t really understand either the rewards or the risks associated with anonymous vs. non-anonymous customer geo-location data.
RSR Research
3) ROI is a function of Product, not Technology
Often there’s confusion between the technology and product.
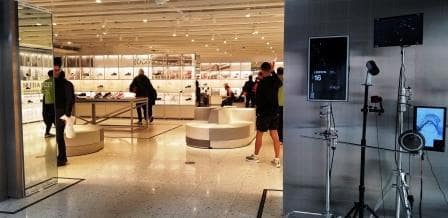
Technology is the building block. For example, you could track customer behaviors with Smart Cameras or a cloud-based engine using CCTV feeds.
A product solves a user’s problem. For example, Queue management is for store managers. Contactless checkouts are self-service for shoppers.
You can have an excellent solution to a specific problem even with simple technology. What matters is that you solved a problem for a user.
You start with clarifications.
For example,
In Behavior Analytics, terminologies have a technical definition.
- Visitor: a person entering the physical store
- Consumer: the end-user of the product
- Buyer: the person who pays
And in the case of groups (two or more people):
- Buying Group: a group with a single buyer, for example, a mother and daughter
- Shopping Group: two or more buyers, for example, two girlfriends
- Service Group: the interaction when an employee helps a customer
To design the map, you can start with the methods from the online customer journey. The next step is to combine the tracking data into an “actual” motion inside the store.
Each time a consumer is exposed to an improved shopping experience, their expectations are reset to a higher level of experience.
Brendan Witcher, VP Forrester
In-Store Customer Journey Analytics You Should Start TODAY
You are now ready to build a data-driven map of customer behaviors.
Let’s dive in.
Example 1) Identify Purchase Points
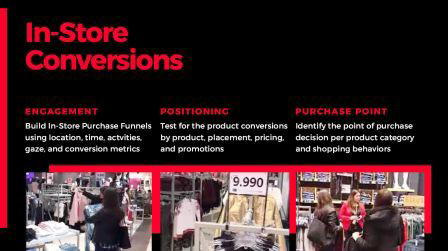
Purchase Point is the event where in-store visitors decide to buy.
In other words, the Purchase Point refers to the WHERE & WHEN the shopper decided to buy the product. It’s the “one step before the checkout process” in physical stores.
Purchase Points are distinctly different from online purchase decisions.
For example,
- Supermarkets: when a customer puts an item in the shopping cart
- Department stores: when a customer tries samples from the makeup counter.
- Digital fitting rooms: the Purchase Point and Checkout merge into a single location because the customer can do both with Smart Mirrors.
The dynamic map captures the Purchase Points using location, time, and behaviors to clarify why people buy.
Example 2) Map Path Trajectory
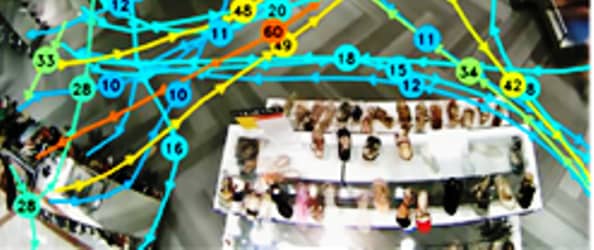
Path Analytics, Customer Flow, and Path Trajectory are different names that describe how people move inside a physical location.
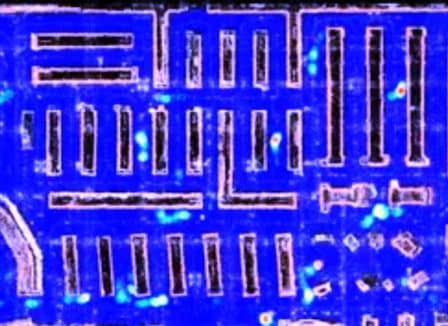
Often, the outcome is a Heat Map. You see different colors that represent different levels of occupancy per period.
And yet,
While visually attractive, Heat Maps are not operational.
To be actionable, Path Analytics provides information on local foot traffic patterns. It requires data on object trajectory.
For example,
- Entry: How many people entered a specific virtual location
- Exit: How many people left a specific virtual zone
- Real-Time Occupancy: How many people are inside a virtual zone in real-time
Example for Path Analysis
Store Layout: Path Analytics paints of picture of how people move inside a physical location. For example, IKEA stores have a pre-defined path. So do museums. The data confirms whether people move inside the physical location as planned.
Big Box Stores: There are stores-within-stores in Big Box Stores such as department stores and Do-IT-Yourself stores. For example, a L’Oreal beauty counter or a Samsung store in Target. With Path Analytics, the customer flow data illuminates the relationship between brands and retailers.
Aisles & Islands: With Path Analytics, you can drill deeper into the in-store design. For example, you can track customer behaviors in aisles, islands, and display fixtures. In other words, you’ll learn more about how people find a specific product.
Path Analysis is helpful to understand the customer’s flow in any physical location, including retail stores, airport hubs, and shopping malls.
Once you mapped how people move inside the physical store, you analyze specific touchpoints.
Example 3) Quantify Local Demand
Occupancy is one of the most versatile and least appreciated retail metrics. It means the number of people staying within a virtual zone per period.
In other words, Occupancy describes “Local Demand.”
For example,
- Real-Time Occupancy is the number of people inside the store right now
- Occupancy reflect the actual sales opportunities for products in the zone
- In optimization tests, Occupancy can be an outcome metric or top of funnel
Examples of Local Demand
- Increased Density: Before the American holiday of the 4th of July, there’s a significant increase in demand for specific products such as meat and corn. The metric of Occupancy provides insights if the store maximized the sales opportunity.
- On-Site Scheduling: Evaluating the impact of assigning an expert associate to work as a cashier during heavy traffic. In other words, you measure which job has more effect on customer service and customer satisfaction.
- Customer Engagement: Measure the correlation between local foot traffic and customer engagement. For example, evaluate the better placement for a coffee station. One option is in a high-occupancy area of frozen meat and fish. A second option is in the less dense deli area.
Occupancy provides quick insights into core assumptions about store layouts and design.
Example 4) Prevent Friction Points
Abandons, bottlenecks, and checkouts create obstacles to the shopping process and the customer’s experience.
Queue Management & Checkouts
The most known friction point for in-store shopping is checkout.
Back in 2010, Kroger Supermarkets deployed the original Queue Management System. It reduced the average waiting time from 4 minutes to 30 seconds and increased sales by almost 2%.
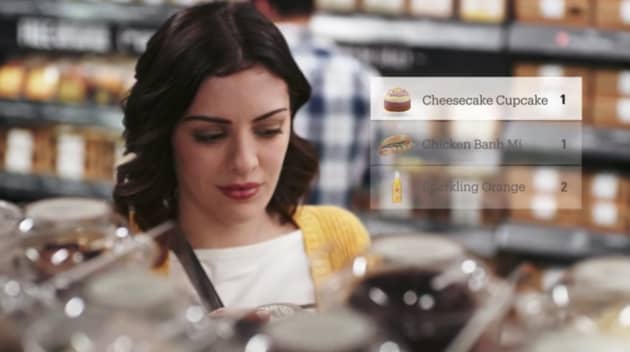
In 2017, Amazon launched the first contactless store, Amazon Go.
Examples of Queue Management
- Queue Management (Last Touch): for example, preventing queue formation by optimizing the number of active cashiers in supermarkets.
- Queue Flow (First Touch): in limited resources, you monitor customer service by queue speed, for example, in Quick Service Restaurants (QSR).
- Self-Service Kiosks: monitor customer engagement and staff service for compliance with self-service payment policies.
- Scan & Go: using devices for self-payment, for example, mobile pay and Smart Carts. The advantage of Scan & Go is the relative simplicity of the solution because it depends on usage by shoppers.
- Touchless Self-Checkout: There is the end-to-end touchless customer experience model, such as the Amazon Go stores. There are also touchless solutions only for payment and checkout, such as self-service tablets in Starbucks.
Always migrate your audience to the path of least resistance.
Kintan Brahmbhatt, Amazon
Examples of Abandon Behaviors:
Abandon behaviors have an indirect but significant impact on the customer experience.
For example,
- Abandon Activity: for example, people leaving the line to the checkout.
- Not Starting Activity: for example, not using counter service at lunchtime
- Not Entering the Store: for example, not entering bank on the 1st of the Month
- Not Returning to Store: for instance, people remember “bad service” and avoid the store in the future. Worse, they tell their friends.
With a dynamic map of the in-store customer journey, you evaluate policies, procedures, and processes. You will find clarity on the impact of the friction points on the customer’s experience and sales.
Next, let’s turn to customer behaviors.
Example 5) Measure Customer Engagement Time
Customer engagement is a critical component of in-store optimization.
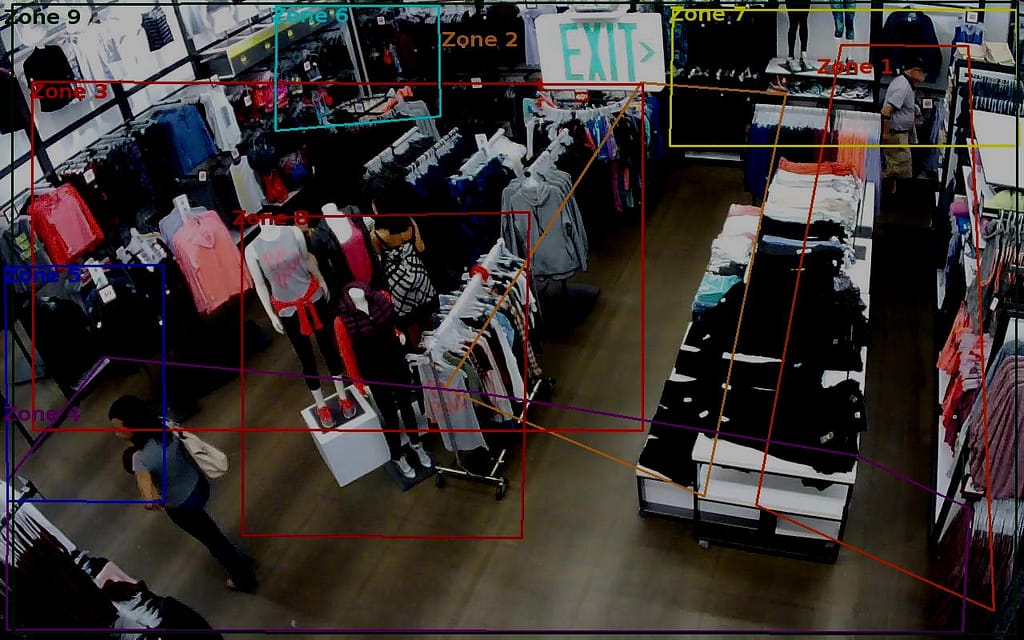
Technically, the analytics of in-store customer engagement depends on:
- Tracking anonymous object behaviors within a virtual zone
- Personal tracking of wireless devices across the physical location.
- Deploy advanced analytics to combine object tracking, device signals, and object attributes from imaging technologies.
The people-tracking technology and infrastructure influence data quality. That will have a direct impact on what you can do.
Examples of Customer Engagement Time
Time-based metrics have different definitions, but the duration of time is a strong signal of customer engagement.
For example,
Engagement Threshold: Set the minimum level of engagement time. For example, in an apparel store, the engagement threshold for black pants was 20 seconds. For premium-priced shirts, the engagement threshold was 40 seconds.
Optimal Engage Time: Identify the most effective customer engagement time. For example, optimal time in front of a cosmetics display in a beauty store is 15 seconds to 90 seconds. In the makeup counter, an optimal time is above 60 seconds.
Time-based metrics for customer engagement are by retail sector and product category. And the evaluation of duration depends on the local environment.
Example 6) Monitor Service Time
What’s the value of an excellent salesperson?
If you ever walked into a retail store with the intent to spend $20 and left with sales of over $1000, you know what I’m talking about.
Telecom companies, for example, have an Optimal Service Time to sell their phone and internet plans. And they design their concept stores accordingly.
Fashion stores also benefit from Optimal Service Time. For example, 20 to 50 seconds of service time that includes a quick hello and pointing to the correct aisle proved to have to most impact on sales.
Service is a critical component in the success of physical stores. Just ask Best Buy.
How do you measure Service Time?
Service Time is the duration of the interaction between an employee and a customer.
For example,
- Structured Customer Service, such as counter service in a deli
- Roaming Sales Associates, such as selling jewelry or electronics
- Ad-Hoc Encounters that exist in no-touch dept stores.
Together with Service Intensity and Service Productivity metrics, Service Time plays an important role in evaluating labor productivity.
Example 7) Optimize Product Positioning
Product Positioning includes position, placement, pricing, and promotions of items in a physical store. You can visualize product positioning with planograms.
These factors impact the sales conversion of the product category and specific items.
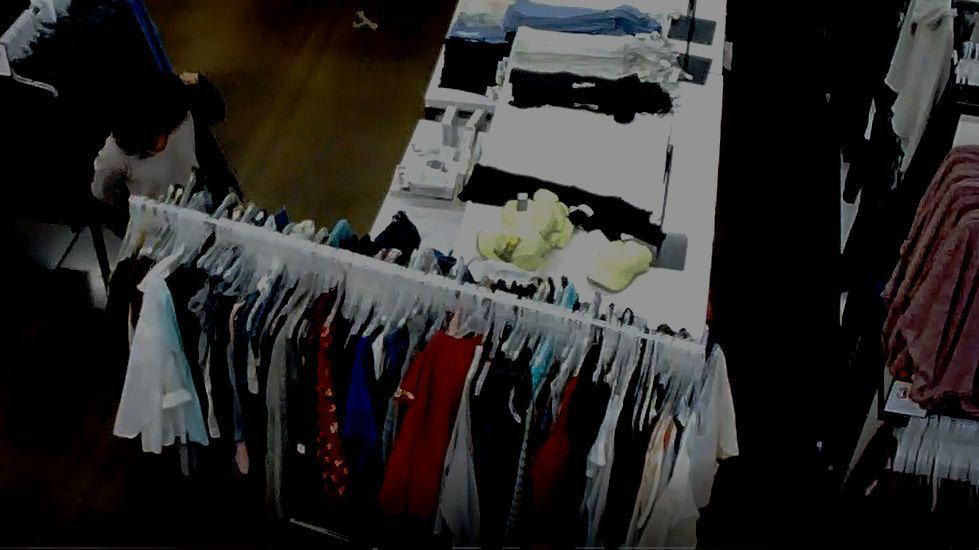
For example,
Clearance Racks: you can optimize the duration of premium products by tracking customer behaviors around prominent displays and regular aisles. You increase profits by reducing the number of items moved to the clearance racks.
Staff Expertise: In certain products – such as jewelry, electronics, and even construction – the availability of an expert associate makes a considerable difference in sales
End Cap Positioning: Brands tend to pay extra for positioning their products in high-traffic end caps. Here’s a hard truth – a high volume of traffic does not necessarily mean customer engagement.
It’s not enough to know what people needs and desires are. We also need to know how that interacts with the store’s environment.
Ted Burkes TED Talk
The Advantages of In-Store Customer Journey Dynamic Maps
If you watched over 1,000 hours of customer behavior videos like me, you know that people always surprise you. Always!
With technological advances of AI, Vision, and Cloud, solution providers can generate in-store customer journeys in real-time.
For example,
- Supermarkets can evaluate product categories and product trends
- Stores can track the offline to online onboarding of Smart Walls
- Mall management can measure the impact of promotions on foot traffic in real-time
With live maps, retailers, brands, and mall managers can optimize their physical locations with the techniques of in-store optimization.
Start today.
