
What is In-Store Optimization?
In-Store Optimization is the process of analyzing behaviors to increase profits, improve operations, and enhance the in-store shopping experience in physical stores.
ISO includes elements of behavioral economics, conversion optimization techniques such as AB testing, and the tracking technologies of location, duration, and attributes.
Why In-Store Conversion Optimization is Important?
In-Store Optimization is important because it allows retailers, shopping centers, and venue owners to increase profits from the assets they already have.
By monitoring conversions of in-store sales funnels, you can optimize revenue per visitor, increase labor productivity, and provide an excellent shopping experience.
What is In-Store Conversion Optimization Strategy?
A strategy defines your aspirations, markets, positioning, capabilities, and systems. And optimization is a framework with repeatable processes to achieve the desired outcome.
Therefore,
The in-Store Optimization strategy is to embed experimentation in the decision-making process of managing physical stores.
ISO strategy reflects choice architecture in location analytics, product assortments, labor scheduling, task management, loss prevention, store layouts, and more.
A Word about Optimization
Optimization is a systematic, repeatable, and teachable process.
An optimization program depends on how many tests you run and their win rate. The growth velocity is a function of the total impact from the wins on the business.
The challenge is to discover what matters, faster.
A Word about Physical Stores
A core difference between digital and physical stores is replicating an idea, a process, or a design. The reason is cost.
In e-commerce, the cost of duplication is close to zero. For example, if you change a product webpage, it is easy to modify all product pages.
In physical retail, you are facing the Multiplier Effect.
You cannot replicate something in the real world without considering the costs of store operations, products, and labor.
Therefore,
In-Store Optimization is about conversions in the context of profits.
A Word about Profit
Retail is a for-profit business. The financial definition of profit relates to the difference between earned revenue and cost expenditures.
But for in-store optimization, the definition of profit is robust. In that context, profit stands for a business with value to customers, employees, and shareholders.
Profit quantifies the outcome.
To execute an in-store optimization strategy, you need a process.
Here is mine:
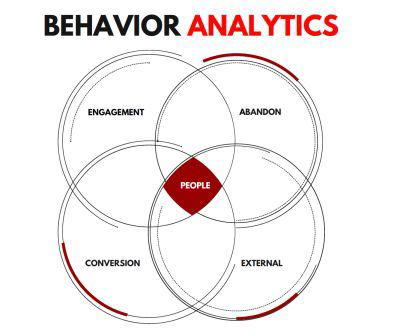
PEACE for Profit: The Step-by-Step Guide to Behavior Analytics
PEACE for Profit™ is a framework of choice architecture for physical locations.
The goal is to identify challenges and opportunities in managing physical stores and turn these ideas into hypotheses to test.
In PEACE for Profit, the definition of profit is robust. In that context, profit stands as an outcome for a business with value to customers, employees, and shareholders.
While PEACE for Profit is a framework for physical retail, the process is agnostic. It applies to managing any physical location.
PEACE stands for people, engage, abandon, convert, and external.
Let’s dive in.
People: How Behavioral Economics Plays in Physical Stores
Behavioral economics studies the effects of psychological, cognitive, emotional, cultural, and social factors on the decisions of individuals and organizations. You find elements of behavioral economics in marketing, design, and retail.
In the PEOPLE phase, you identify the targeted behaviors.
Here are some of the relevant theories:
1. Why We Buy: The Two Brains Theory
In “Thinking Fast and Slow,” the Nobel Prize winner Daniel Kahneman introduces the theory of the two brains. While one system is rational and slow thinking, the second system is quick, automatic, and intuitive.
In retail, for example, you use the two systems theory in evaluating impulse purchases. Buying milk is often a rational purchase (and probably on your grocery list). But buying chocolates at the checkout counter is an impulse purchase.
2. The 7 Principals of Influence
When professor Robert Calidlini published Influence in 1984, he had no idea that he would revolutionize marketing. The seven principles of influence are commitment, consistency, liking, authority, scarcity, social validation, and reciprocity.
In retail, you see the principles of influence everywhere, from branding to promotions.
3. Brand Loyalty: How to Build Habits
Professor P.J. Fogg created the Behavior Design Lab at Stanford University. One of his famous innovations is the theory of building habits using tiny steps.
In the tiny habits method, the anchor is the existing routine you already have. You then attach a new behavior to wire in the habit. Among the students of P.J. Fogg were the founders of Instagram.
4. (Hook) How to Build Habit-Forming Products
In the HOOK model, Nir Eyal defined the user’s journey in four phases: a trigger to start using the product, an action to satisfy the trigger, a reward for taking action, and an investment that makes the product more valuable to the user.
The HOOK model is a blueprint for retail loyalty apps. It also applies to in-store events.
5. Psychology of Color
Colors affect behaviors. The psychology of color plays a part in marketing, branding, and culture. For example, colors play an important factor in logos and window displays.
For example, pink is the personality of Victoria’s Secret. Red and yellow (ketchup and mustard) are a combination that entices hunger, evident in the logos of McDonald’s. And red, black, and white for action are the colors of the Behavior Analytics Academy.
Once you have identified the behavior, the next step is to quantify the behavior.
Engage: Quantify Customer Behaviors
Stores are first and foremost sales floors. Beyond the traditional bricks-and-mortar store, there are new models such as pop-up stores, showroom stores, and dark stores.
Regardless, you can quantify the behaviors of customers and employees.
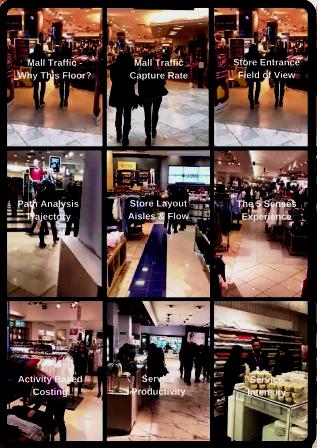
The technology tracks location and duration. For example, a customer stands in front of the cosmetics counter longer than 30 seconds. Another example is object attributes such as distance between the eyes or the color of a shirt.
The ENGAGE step packages behaviors in metrics.
For example:
6. Sales Opportunities (Counting People)
Visitors are sales opportunities.
The metric “Visitors” is versatile. It belongs to store operations, demand forecasting, workforce scheduling, location-based marketing, and more.
Here are some metrics from people counting:
- Entering and Existing of people visiting a physical location
- (In-Store) occupancy of a virtual zone
- Proximity Traffic of people passing nearby
- Stay Time for measuring the duration of engagement
- Object recognition for counting returned visitors
7. Sales Formula for Bricks-and-Mortar Stores
Retail sales are a function of how many people visit the store, the rate browsers converted to buyers, and the average order value.
SALES = TRAFFIC X CONVERSION X AVERAGE BASKET
For example, if a store has 100 daily visitors and 25 transactions, the conversion rate will be 25 divided by 100, or 25%. If the average basket is $50, then sales are $1250.
The formula helps to articulate the impact on sales. For example, foot traffic volume will drop because of a hurricane. But it will increase water and generators conversions. And the average basket may increase by 5% during the days before and after the storm.
8. Labor Productivity KPIs
Evaluating how staff impacts store operations and sales is a critical feature of in-store optimization. While employees have many tasks depending on the retail sector and their position, optimization falls into three broad categories.
- Performance: You use performance metrics to build the schedule and evaluate the stores and employees; for example, Service intensity, Service level, Sales per Hour, and Service Productivity.
- Service: Location-based metrics indicate if service was available, for example, tellers in retail banking. And time-based metrics such as Service Time and Optimal Service Time reflect payroll cost on customer experience.
- Alerts: real-time triggers and notifications indicate that employees should perform a specific task. For example, open another cashier’s till or clean the spill on the floor.
9. Time-based metrics for Engagement
Duration is a signal of interest. For example, Google uses the “Time on Page’ metric as a ranking factor. For YouTube, Watch Time is a core KPI.
In people-tracking technology, accuracy is vital for time-based metrics.
For example, Store Dwell Time does not require high accuracy and often is an estimate from tracking a sample of smartphones. But customer engagement metrics need high accuracy because time-based metrics are in seconds.
10. Attributes and Activities
In addition to the location and duration of objects, people-tracking technologies generate data on the object’s attributes and activities.
In people-tracking solutions, object attributes include gender, age, and demographics. And object activities refer to gaze-tilting, eye-tracking, and touch activities.
However you use the technology to generate data, optimization requires metrics.
After you have quantified the behavior, the next step is to understand the context of why that behavior occurs.
Abandon: Preventing Friction for In-Store Shopping
For in-store optimization, context is the local environment. Contrary to online behaviors, context is critical for understanding behaviors in physical environments.
Because the impact of a bad customer experience is more significant than excellent customer service, the next phase is ABANDON.
Specifically, you search for friction points.
For example,
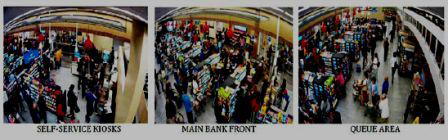
11. Queue Management
In a retail environment, checkout queues are the most pernicious friction point in the shopping funnel. The combination of wasted time, a reluctance to spend money, and the last touchpoint make queues toxic to the shopping experience.
Queue Management solutions answer how many cashiers need to be active to prevent the formation of queues.
Queues have formats such as long linear lines, parallel rows, and hubs. Queues exist as the last touchpoint in supermarkets, in-funnel touchpoint in airline checkouts, and first touchpoint in quick-service restaurants.
12. Queue Flow
Sometimes there’s not much a retailer can do to prevent queues.
For example, the typical post office has a limited number of teller stations. And in Disneyland, queues form because there are many people inside the theme park.
In such situations, you focus on speed.
Queue Flow refers to how fast people leave the line.
In Starbucks, for example, a person leaves the queue every 30 to 60 seconds (on average) because the cashier only takes the order and payment. Another employee makes the coffee and warms the toast. The waiting time has two phases, before and after the order. Psychologically, it works better.
13. Self Service
Self-service refers to activities performed by the shoppers.
Self-service could be checking in, ordering from digital menus, and payment. The checkout could be a self-service kiosk, a mobile device, or a contactless system.
In mapping the customer journey, you should remember the checkout often consists of more than a single step. In fashion stores, for example, taking the dress to the fitting room is akin to adding the product to an online shopping cart.
14. Product Fulfillment
If the cashier asks you, “did you find everything you wanted?” it is one way to check if the product was on the shelf. Another is robotics. And task management is vital.
Whether you found a product or not depends on the supply chain, out-of-stock items, and product fulfillment.
And yet,
If the product is in the store but not on the shelf, you have an optimization challenge.
You can test for:
- Task: monitor the tasks and quality of the outcome
- Timing: how often do employees check if products need restocking
- Position: is the product positioned in a “place that makes sense” to consumers.
Optimization of product fulfillment is often a quick win.
15. Loss Prevention
The paradox of behaviors in physical stores is that similar behaviors could indicate high interest in the product or a theft attempt.
For example, take loitering. If a person stands in front of the first aid display, does it mean she is searching for aspirin or trying to put the bottle inside her coat?
Regardless, the store needs a system that calls an employee to come and check. The trigger for the alert will depend on a time-based threshold, such as 5 minutes.
Friction creates obstacles.
The goal of in-store optimization, therefore, is to identify and cancel friction from the shopping experience.
Next, you’ll search for ways to increase conversions and sales.
Convert: Optimization Techniques for In-Store Customer Experience
Most retail stores are tactical. It means stores serve as sales floors, showrooms, and service centers. But headquarters makes most decisions. The local store executes planograms, tasks, and a myriad of corporate policies.
And yet, physical stores are also the most effective touchpoint with customers. That makes the bricks-and-mortar store an excellent place to test products and processes.
For example,
16. In-Store Sales Funnels
To map in-store funnels correctly, you need to understand the difference between correlation and causation. Correlation is about the relationship between two or more variables. Causation occurs when one event causes a second event.
Your objective is to map a cause-to-effect funnel that ends with the desired outcome. In other words, the process is funnel optimization.
For example, take the checkout process in a supermarket. The goal of a mobile device checkout is to skip the steps of walking to the checkout lane and waiting in line before the payment service. The payment process occurs in a self-service handheld.
17. Product Placement
The placement of a product correlates with sales. For example, a diet coke bottle can be found in the soft drinks aisle, at the end cap, and next to the deli. In the aisle, it could be next to other diet sodas or other cokes. The soft drinks could be on the eye-level shelf or down at the bottom of the display.
And yet, more is not always better. With optimization, you identify the most effective placement for products, categories, and assortments.
Planograms are designs that tell employees the exact position to place a product. And because there is a financial agreement between brands and retailers, these placements have value. With optimization tests, you can quantify and improve product positioning.
18. In-Store Promotions
In-Store marketing promotions exist in signage, discounts, and events. In Costco, you get food tasting. In beauty stores, you have digital signage. The advertising content will change according to input from facial demographics.
Events proved to be valuable in-store promotions. For example, a free makeup offer is the first step to entice customers to enroll in the loyalty program.
19. The Psychology of Pricing
Pricing plays a vital role in optimization. You can test for changing product prices. You can also evaluate product price in context to the local store environment.
Anchoring is a good example. Anchoring means that the first price will anchor your expectations. In a physical store, you see the impact of anchoring in the clearance racks with 40%, 50%, and 70% off the regular price.
In 2001, I was a pricing manager at Symantec. One debate was the rebates on the Norton Anti-Virus software. If rebates are continuous, do they devalue the product?
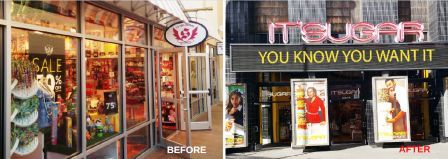
20. Store Layouts & Displays
Store layouts and fixtures are expensive to modify. As a result, concept stores are a one-time deal every couple of years. Remodeling is a capital expenditure.
But storefronts, displays, and windows change continuously. For example, you test window displays for the prominence of the brand against a product. You test displays for clarity and complexity. And you can move products in and out of the premium stand in the front of the store.
Once you identify a behavior, quantify it, and evaluate the local context, you have the ingredients to design an optimization test.
External: AB Testing for Physical Stores
AB Testing and other optimization techniques are the processes to identify wins. The goal is to speed the process of discovering successes and win rates.
21. Offline vs. Online Conversion Optimization (ISO vs. CRO)
Online Conversion Rate Optimization (CRO) is a system to increase the number of website visitors that purchase online.
ISO does not directly align with CRO, but they share basic foundations. Most important, both disciplines are rooted in building a process.
The primary difference between online and offline conversation optimization is accuracy. Because online stores can have a large volume of visitors, the test results can achieve a statistical significance of 95% plus.
Most physical stores won’t have the threshold of 10000 visitors. As a result, you validate the wins by repeating the same test in three different locations.
22. In-Store Heuristics Evaluation
In ISO, heuristics stands for expertise. In heuristics evaluation, conversion experts search for behaviors with emotional clarity and high intent to buy.
If you operate a beauty store in a shopping mall, next to three other beauty stores, your shoppers will likely know your brand. Most importantly, they have a well-defined set of expectations about your store.
The same reasoning holds if you’re a brand operating a store-within-store.
A different case is if you’re selling water bottles in a convenience store. In that case, your shoppers look for water bottles in the aisle and the refrigerator, but impulse buys typically come from positioning the water bottles next to the cashier checkout.
Heuristics evaluation creates the initial list of what works or not, what we should test, and the priorities.
23. AB Testing
The core idea behind optimization is to increase conversions for any call-to-action. That means that the conversion rate comes down to a simple formula:
Conversion Rate = Number of Goal Achievements / People
AB Testing is a way to compare between two versions. You create a hypothesis about a specific element and test if your theory is correct. In AB Testing, you set a goal, clarify the hypothesis, set up the split test, run the test, and analyze the results.
A common trap is a false positive outcome. It means you will be spending resources on implementing something that does not affect conversions.
AB Testing is a statistical experiment. Sample size matters. Consistency matters. A valid test requires a statistically significant outcome to ensure that scale will bring consistent results.
Conversion metrics are binary. In other words, the action occurred or not. That’s why conversion metrics are relatively easy to test and evaluate as cause-and-effect.
Creating a Culture of Optimization in Physical Stores
In-Store Optimization is feasible because people-tracking technologies have become cost-efficient and accurate enough. The Location and Indoor Location markets are growing fast.
And yet, the most significant obstacles are culture, skills, and a lack of innovation mindsets. The keys to ISO are clarity, transparency, and communication.
You’ll increase the benefits of optimization by learning what works and what does not.
Winning retailers deeply understand the unique role of the physical store. Growth comes from a culture of experimentation and increasing the velocity of wins.