
If your strategy is to be “customer-centric,” you need Optimal Service Time.
Good customer service in retail stores significantly impacts improving the customer’s experience and increasing in-store conversion rates and sales.
For example,
With an in-store customer tracking solution in an apparel store, Chile’s Intelligenxia identified the Service Time of 20 to 50 seconds as “optimal” because it had the most impact on increasing the store’s conversion rate.
In fact,
The most effective in-store interaction between an associate and a shopper was a quick chat and brief engagement with a product.
Longer service times did not increase the probability of a sale.
Let’s dive in:
What is Optimal Service Time?
Optimal Service Time measures the effectiveness of customer service events between on-site staff and customers. Most importantly, it refers to the impact of the length of the interaction between staff and visitors on the sales conversion.
To optimize customer service, you need to measure the in-store service time.
How to Calculate In-Store Service Time?
To capture and measure the In-Store Service Time, you need an anonymous and accurate in-store customer tracking solution.
For example,
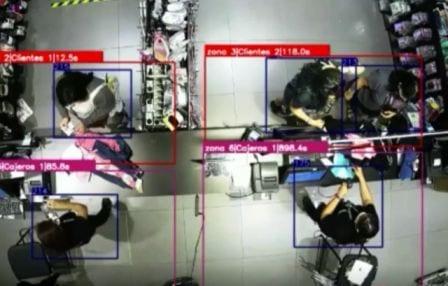
Intelligenxia deployed @edge people-tracking technologies, including camera-based sensors and AI Vision-based analytics server.
Consistent with the Good Enough Accuracy method, the granularity for the Optimal Service Time analysis was in 10 seconds segments.
Why is Optimal Service Time Important?
Optimal Service Time solves the challenge of measuring, monitoring, and managing customer service in physical retail.
In physical stores, retailers often deploy Task Management solutions to help employees know what to do, who expected to do it, and whether the task is done.
The objective of the technology solution is to improve communication between corporate and stores and increase the effectiveness of store operations.
And yet,
Task Management solutions deal with “structured” tasks.
They don’t include interactions between the store associates and visitors.
Worse,
Because the system monitors tasks but not customer service, Task Management often generates a conflict of interests against good customer service.
That said,
Training and education of the frontline staff is a priority to retailers.
With Optimal Service Time, retailers clearly understand what service duration works best in a physical store.
Why are Time-Based Metrics Important to In-Store Optimization (ISO)?
Time-based metrics are standard with store operations because they relate to labor productivity and customer engagement.
Activity-Based Costing (ABC) is the preferred method to evaluate the cost of payroll. The approach aligns the payroll expenses in context to the length of activities.
Beyond Point of Sales (POS) data, time-based metrics evaluate the ‘intent to buy’ and in-store customer engagement.
For physical retail, here are time-based metrics to know:
- Transaction Time: length of the payment process
- Idle Time: the difference between POS transactions
- Wait Time: time spent in a queue before being served
- Checkout Time: length of the check process includes queuing and paying
- Service Time: customer service time at a counter or on the sales floor
- Stay Time: technical term relating to object tracking in a virtual zone
- Static Time: technical term relating to object positioning
- Engage Time: length of stay inside a virtual zone
- Dwell Time: length of stay inside the store.
How In-Store Metrics different from Online KPIs (Dwell Time)?
“In information retrieval, dwell time denotes the time a user spends viewing a document after clicking a link on a search engine results page. Dwell time is the duration between when a user clicks on a search engine result and when the user returns from that result or is otherwise seen to have left the result.”
Wikipedia
If you closely read the Dwell Time definition, you’ll realize that the online world is binary. For example, you encounter a webpage, and the system monitored how long you stay.
There is a structure in the data.
In other words, you can structure the online time-based metrics because you have a well-defined location, entry, and exit.
In a physical store, shopping behaviors are fluid, flexible, and robust.
With people counting, you measure arrivals and exiting metrics. With device-based tracking, you calculate the store’s Average Dwell Time.
And yet,
In-Store metrics are not always so clearly defined.
For example,
- Locations: instead of a webpage, tracking technologies create fluid virtual zones.
- Conversions: instead of binary calls to action, you define Inputs and Outcomes.
- Behaviors: instead of linear yes/no online funnels, in-store funnels are complex.
Let’s see the Optimal Service Time in action:
(Case Study) Step-by-Step Optimal Service Time
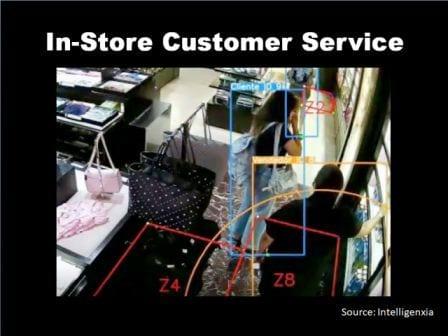
Intelligenxia deployed an AI Vision-based solution in an apparel store located in Santiago de Chile airport. The store serves as a pilot store for a variety of in-store customer tracking and customer engagement projects.
For example,
Here are highlights relating to the Optimal Service Time:
Step 1) Define In-Store Customer Service Time
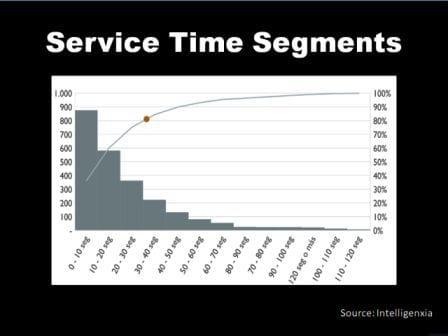
All interactions between associate and visitor were tracked and segmented in 10 seconds intervals (customer service events).
80% of service events lasted up to 35 seconds.
Analyzing the service-time data, Intelligenxia divided in-store service events into three behavior-based segments:
- Less than 20 seconds: short service event such as saying hello or a quick question
- 20 to 50 seconds: customer service event includes a question and engagement with product/s
- More than 50 seconds: the customer service event occurs while the shopper is in a state of high engagement with the product
Next, you explore outcomes.
You investigate statistical correlations.
Step 2) Correlate between Service Rate and Conversion Rate
To preserve data consistency, Intelligenxia negated the impact of traffic volume by searching for correlations between the Service Rate and Conversion Rate.
Service Rate is the ratio of service interactions to total traffic.
For example,
If the solution captured 24 service interactions lasting 20 to 30 seconds, and the number of daily visitors is 264, the Service Rate is 9% (24/264=9%).
Conversion Rate is the ratio of transactions to total traffic.
For example,
If the Point of Sale (POS) shows 105 transactions and the people counting solution captured 264 daily visitors, the daily sales conversion rate is 40% (105/264=40%)
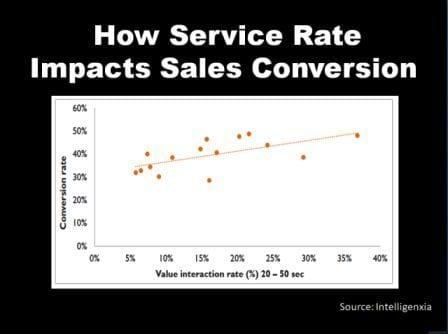
To find the Optimal Service Time, you repeat the correlation exercise for each Service Time segment and each day within the evaluation period.
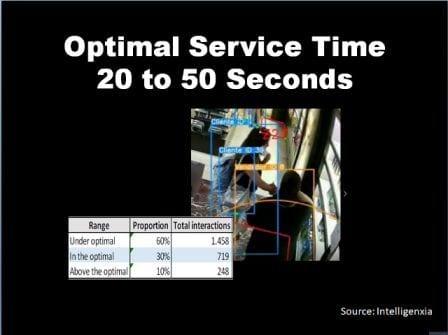
To Intelligenxia, Service Time segments are “valued” if there is a strong correlation (above 50%) with the store’s Sales Conversion.
During the Evaluation Period, the data pointed that the “valued” Service Time segments were between 20 to 50 seconds.
In other words,
The most productive service interactions lasted between 20 to 50 seconds.
Therefore,
To increase the store’s sales conversion, you should train employees to interact with customers longer than 20 seconds and limit the interaction to 50 seconds.
Step 3) Measure Labor Productivity with Service Rate
Once you measure the in-store service time and correlate the good customer service to revenue, the next step is to evaluate service impact on labor productivity.
To understand in-store customer service in the context of the real-time environment of the store, you connect the demand (visitors) to supply (associates).
Service Rate per Associate = (service events / associates) / visitors
For example,
If the daily sum of service events is 162, the sum of visitors is 264, and there are three associates on-site, the Service Rate per Associate is 20.
Therefore,
On average, each of the store’s associates interacts with customers 20 times a day. In other words, there are 20 customer services events per employee.
Next, you investigate outcomes.
In this case, Intelligenxia correlated between the Service Rate per Associate and the store’s Sale Conversion Rate.
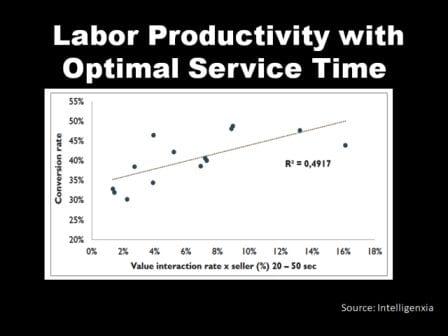
The conclusion is –
Increase the optimal customer service events to increase sales conversion.
By measuring in-store service time, identifying the optimal service time, and training employees to increase the service events, you created the environment for good customer service, increase in dwell time, increase in sales conversions, and increased labor productivity.
Go from Good to Excellent Customer Service in Retail
“When I ask Trader’s Joe customers why they love the company so much, they almost always mention friendly employees who give you whatever help you need. If you have a question about a product, you don’t have to find the “right” person to ask; chances are, any employee you see can help you. If there is a long line at the checkout, chances are someone shelving cans of soup or arranging the flowers will come over and open another cash register.”
Zeynep Ton, Good Jobs Strategy
With Optimal Service Time, you measure, monitor, and manage good customer service.
For example,
In apparel stores, training associates to connect with customers, answer questions, and have a quick engagement with a product positively improves the customer’s experience and increases sales.
Optimal Service Time is just one metric in various techniques used to increase conversions and profits with In-Store Optimization.