Retail KPIs illuminate the resilience of physical stores. Key Performance Indicators (KPIs) help articulate what works best, what does not, and what you should do to improve retail store performance.
The retail store of the future will offer an array of digital and sensory customer experiences. Stores thrive because people are social. People love shopping in person, alone or in groups. They love to touch products, immediately take purchases, and immerse themselves in the store’s environment.
Despite the trends, even the most sophisticated AI solutions will not replace store managers. For store managers to compete effectively, they need an understanding of the retail KPIs and metrics and have the know-how to optimize store performance.
Topics covered in this blog:
- KPIs for Retail Store Managers
- Opportunities from Store Location KPIs
- Customer Behaviors as First-Party Research
- Product Positioning with In-Store Lifecycle
- Operations with Retail Store Management
- Monetization KPIs as Success Outcomes
- KPIs Examples for Store Optimizers
KPIs for Retail Store Managers
Store Managers play a crucial role in retail.
They manage daily operations, inventory, staff recruitment, and scheduling, address customer service challenges and resolve complaints, execute in-store marketing promotions, enforce safety and loss prevention, and manage sales and budgets.
Sadly, many retailers view stores as tactical sales floors. Effectively, store managers are only judged by their management skills.
Too bad.
Because store managers have a front-row seat to retail chain knowledge, they should play an interactive role in strategy and growth. They interact directly with customers, understand why products sell, and represent the brand.
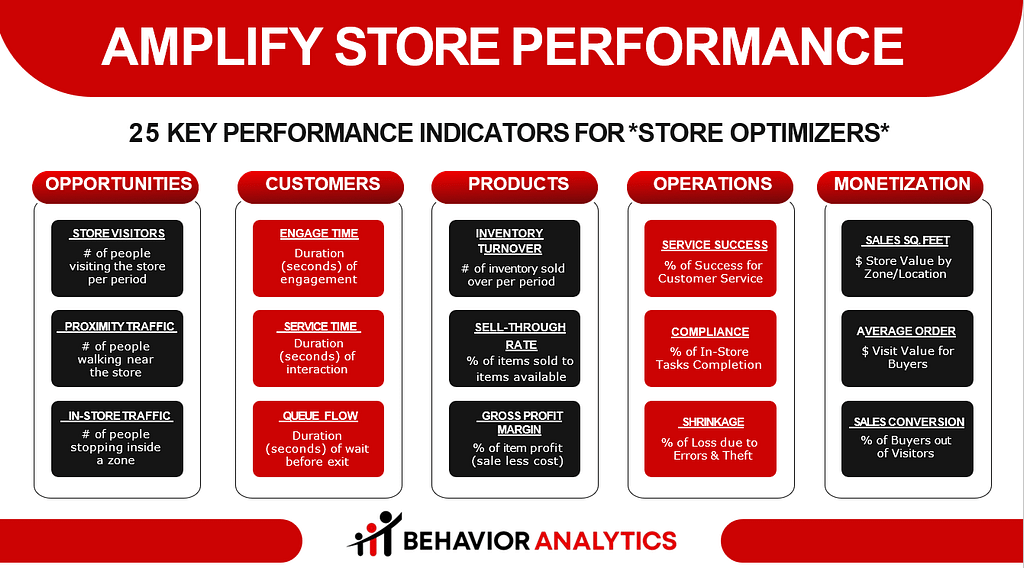
Top 25 Retail KPIs for *Store Optimizers*
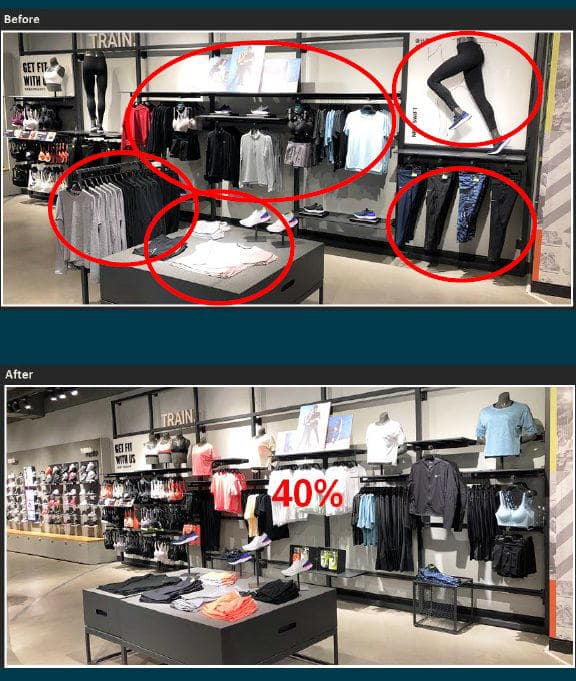
The Store Managers of the future are also *Store Optimizers.* Optimizers conduct in-store experiments to discover influencing behaviors that influence targeted behavior and amplify store performance.
Below are the top 25 KPIs **Retail Store Optimizers**:
Let’s start with definitions.
Definition of Key Performance Indicators (KPIs)
Key Performance Indicators (KPIs) are quantified numbers and formulas that help companies evaluate performance, guide decisions, and align goals.
In retail stores, KPIs illuminate store performance, customer experience, product lifecycle, site operations, and financial success. For example, Comp Sales, Sales per Square Feet, and Gross Profit Margins are vital Key Performance Indicators for retail stores.
Retail KPIs Formulas vs. Empirical Metrics
Empirical Metrics are quantified measures generated from empirical data, which means actual, observed data rather than theoretical models or calculated formulas.
Empirical metrics require data validation models to define how accurately they describe real-world attributes. For example, Footfall Traffic is an empiric metric that depends on the accuracy of auditing the number of people counted.
Sales Conversion, for example, is a calculated formula that depends on two empirical metrics: the number of transactions and the value of sales.
Retail KPIs can be either empirical metrics or calculated formulas. The definition of KPI depends on the importance of data in achieving your goals.
You start the location of the store.
Opportunities from Location KPIs
Any in-store analytics solution must first answer, “What is the value of a physical location?”
In other words, before you evaluate the store’s performance, you seek to understand the opportunities for that specific location. Specifically, you use KPIs and metrics to illuminate the Demand (Foot Traffic), Traffic Acquisition, and In-Store Traffic.
Let’s dig deeper.
Store Opportunities: Foot Traffic
Foot traffic data is commonly used to evaluate a store’s opportunity, and the common retail KPIs for foot traffic are Store Visitors.
Visitors
Store Visitors refers to the number of people who visit the store per period. By entering the store, people become a sales opportunity.
Technically, you can use a sensor-based people tracker to count the number of people crossing the store’s entrance. Another option is to track the visitor’s cell phones using wireless technologies. Regardless of your people tracking solution, Store Visitors are a people counting metric.
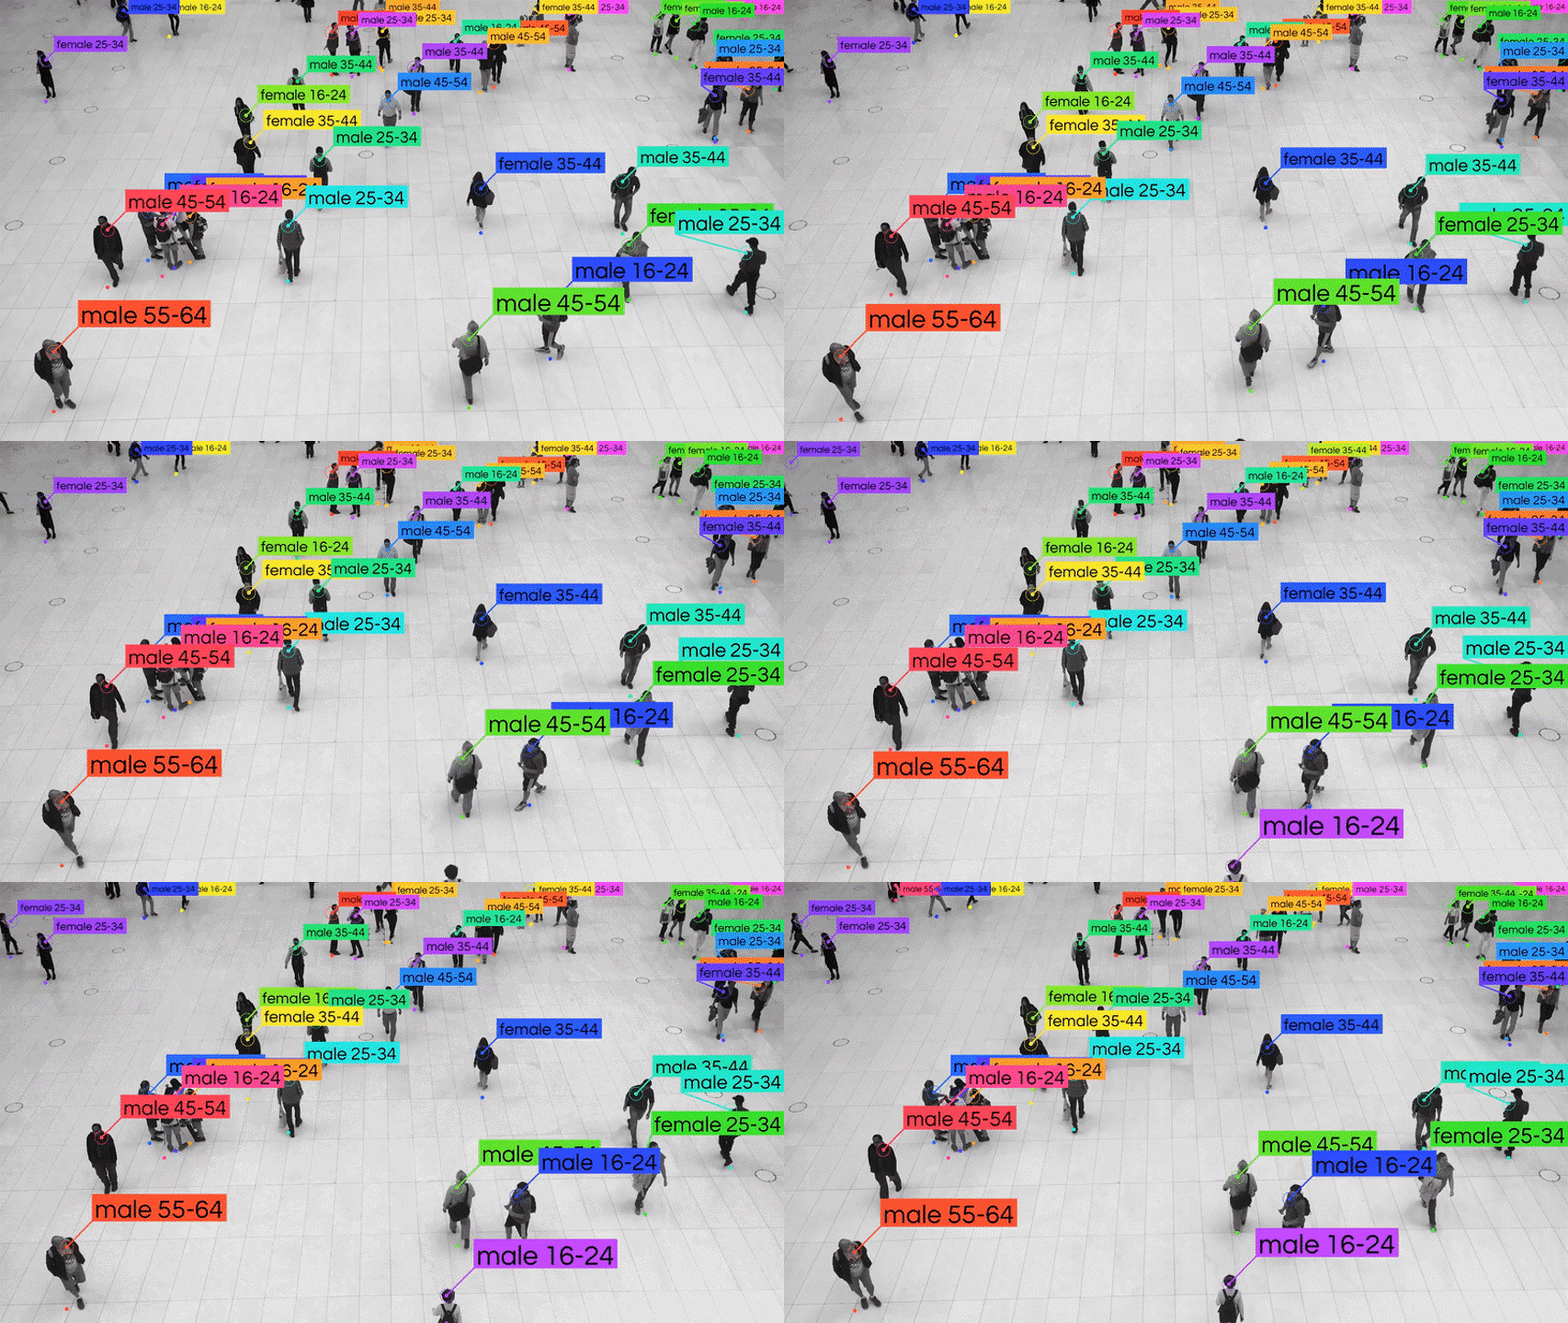
The footfall data can be segmented in different ways, specifically:
Arrivals
Arrivals refers to the number of people who enter the store per period. For example, Daily Visitors describes the number of people who enter the store during the day.
Exiting
Exiting counts the number of people who exit the store. The *Existing* metric is often used for operational purposes, such as in Queue Management.
Groups
The Store Visitors metric typically refers to individuals who visited the store. And yet, counting Groups is vital for better analytics, operations, and merchandising.
For example,
Shopping Groups reflect one shopping unit, such as a mother and daughter or a couple. While the group shops together, there is a single buyer. Another example of group behaviors occurs when employees go in and out of the store to help customers in the parking lot.
Visitors by Demographics
Segmenting customers has business benefits, from store operations to marketing and merchandising. Demographics such as the differences between men and women, age ranges, and race are feasible technically with facial recognition, but you need to be mindful of privacy and government regulations.
Visitors by Cohorts
In addition to segmenting visitors by their demographic characteristics, you can segment visitors by periods. For example, you can create a cohort of visitors who come to the grocery store on Sunday mornings.
Returning Visitors
Despite being a desired KPI by retail executives, Returning Visitors is a metric facing technical, privacy, and regulation challenges. It is one of those metrics you need to ask, not if you can (because facial recognition is smart enough to track people over a long period) but if you should.
In summary,
*Store Visitors* metrics answer the question of what the actual sales opportunity is.
Store Opportunities: Traffic Acquisition
Online marketing depends on the ability to track user behaviors across the internet and the attribution to website visitors. For example, advanced marketing campaigns use attribution to personalize promotions.
In Behavior Analytics, we don’t seek personal information but rather patterns of behavior that can be translated into store policies and better decisions.
In other words, in-store analytics depends on tracking anonymous behaviors. It works because traffic acquisition is directly related to the site’s location.
For example,
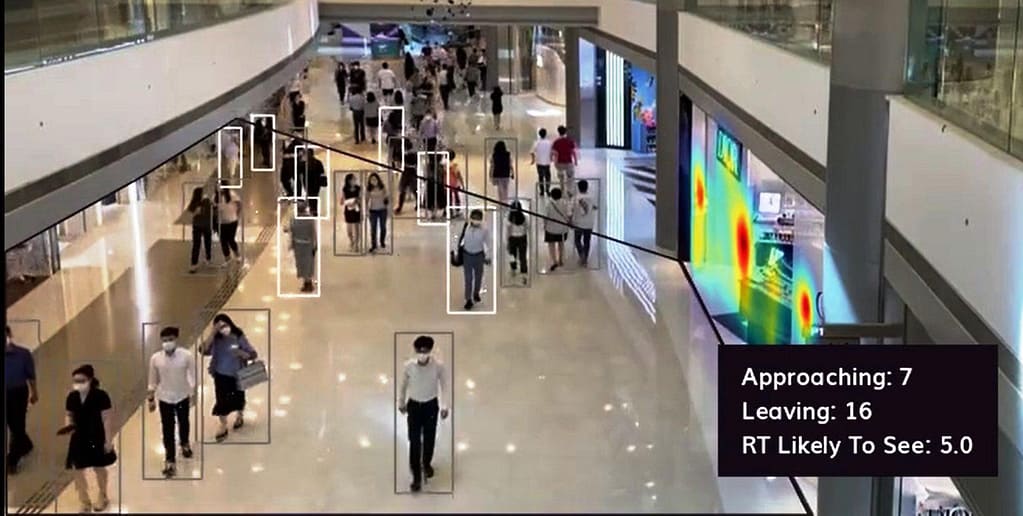
Proximity Traffic
Proximity Traffic is the number of people who walk near the store.
There are technical considerations when defining “nearby” traffic because it matters if people can physically see the store and what they remember from the storefront and windows. You can dig deeper into proximity traffic with complexity and time metrics.

Mall Traffic
The metrics of *Mall Traffic* relate to the number of people who enter the shopping center from all entrances per period. Mall Traffic reflects the value of leasing a mall store.
The Mall Traffic KPI helps to clarify the boundary between mall management and retail stores. For example, Mall Traffic is at the top of the Mall-to-Store Funnel.
Capture Rate
Capture Rate is the ratio between people who pass near the store and those who enter the store. The formula is:
% Capture Rate = # Store Visitors / # Proximity traffic.
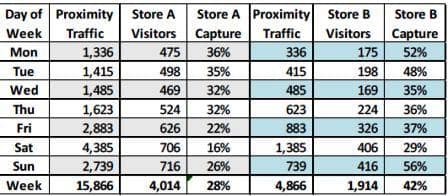
Trade Zone Traffic
Trade Zone Traffic refers to the estimated number of people visiting the store, considering its location, travel distance, competition, and demographics. For example, you get insights into zones such as a zip code area or downtown.
Trade Zone Traffic is often estimated by tracking wireless signals from mobile phones with technologies such as Wi-Fi and GPS.
Point of Sales (POS) data can generate insights into why people visit the store.
For example,
Marketing Effectiveness
You can track how foot traffic changes in context to the baseline traffic after a marketing campaign.
With advanced marketing solutions, you can attribute online marketing to changes in traffic and sales. For example, you can correlate coupons to sales
Product Pickups
*Buy Online Pickup in Store (BOPIS)* omnichannel metrics will indicate how many customers use the store as a fulfillment center. In Behavior Analytics, you use BOPIS data to help articulate why convenience matters to your customers.
Product Returns
Returning products to the store is convenient for customers, especially if the product was bought online. While there is a debate about how the challenges of fraud and costs play a role in effective product returns and additional sales, the trend is likely to stay.
In summary,
You probably won’t know the name of the person visiting your store, but you have enough clues to understand why people come.
The fun begins with in-store analytics.
Store Opportunities: In-Store Traffic
The in-store traffic metrics tell you where people are inside the store. In other words, you want to understand the in-store sales opportunities.
For example,
Occupancy
Occupancy refers to the number of people staying simultaneously in the store or a zone. In other words, occupancy is the number of visitors at this moment.
Occupancy is often used to determine capacity compliance, such as the maximum number of people in a train station, a restaurant, or other public buildings.
Density
Density refers to the concentration of people within the zone, for example, the number of people per square foot.
Zone Traffic
Zone Traffic is the number of people visiting a specific area in the store.
How you define a “virtual zone” has technical aspects. Regardless of their accuracy, zone traffic metrics measure the in-store customer flow.
Visualization tools such as Digital Twins, Heat Maps, and Customer Journey Mapping show how people move inside the store.
For example,
Drop Off Rate
You get drop-off rates when you treat customer flow from one point to the next as conversion. For example, take customer flow in a department store. If you have 10 people in the cosmetics department and only 5 people move next to the men’s clothing, you have a 50% drop-off rate.
Probable Path Rate
As a predictive KPI, the Probable Path Rate is an exciting new in-store metric that predicts the likelihood that a visitor will move from current location A to a future location B.
Probable Path Rate requires local store context. And yet, you may be surprised to learn that most visitors have only three to maybe five paths from each point inside the store.
The benefits become evident once you start experimenting with influencing customer behaviors to encourage cross-sells and up-sell opportunities.
Cool.
Customer Behaviors as First-Party Research
Key Performance Indicators (KPIs) and metrics are customer analytics tools. You want to understand how to target and influence customer behaviors that amplify sales.
By mastering empiric and calculated metrics, you illuminate what’s happening inside the store and, most importantly, what you can do about it. In other words, in-store metrics are, in essence, comprehensive *customer research* in physical stores.
Specifically, you want to Quantify Customer Engagement, Customer Service, Customer Satisfaction, Customer Experience, and Customer Monetization.
Let’s dig deeper.
Customer Engagement
*Customer Engagement* defines the relationship between customers and products. Because Behavior Analytics is about influencing customer behaviors, you must first define those behaviors.
Retail KPIs include time-based metrics and conversion rates.
Time-Based Metrics
Time-based metrics measure the customer’s level of interest. In other words, how long people stay tells us whether and how much they care about the product.
For example,
Store Dwell Time
Store Dwell Time is the duration of entry-to-exit store visits.
Many retailers use the Average Dwell Time as a guide because there is a correlation between the length of stay in the store and sales. It’s an easy rule of thumb.
Yet, my preference is to avoid averages and focus on distribution.

Zone Stay Time
Stay Time refers to the duration of people staying inside a virtual zone. Stay Time is one of the core retail KPIs often used to evaluate in-store customer behaviors.
While Dwell Time measures the duration from entry to exit of a single visit, Stay Time is a more flexible metric. In some cases, people go in and out of a virtual zone. At other times, you only care about whether the zone is active or not active.
Engage Time
Engage Time is the duration of a person’s interaction with a product or display. Technically, the Engage Time metric requires higher accuracy of location and time.
Time-based metrics are often measured in minutes because of technical requirements.
Sometimes, it is worthwhile to invest in a more accurate tracking solution and get a consistently accurate result in seconds. This is especially true if you want to delve deeper into consumer behaviors such as impulse purchases, habit-based shopping, and switching behaviors.
Conversion Rates
Conversion Rates measure how people respond to a call to action.
For example,
Stay Rate
Stay Rate is the percentage of people stopping in front of the display out of everyone who walked nearby.
For example, the end caps in a supermarket are considered lucrative in-store placement because there is more foot traffic between the aisles. The stay rate helps to understand how valuable product placement is.
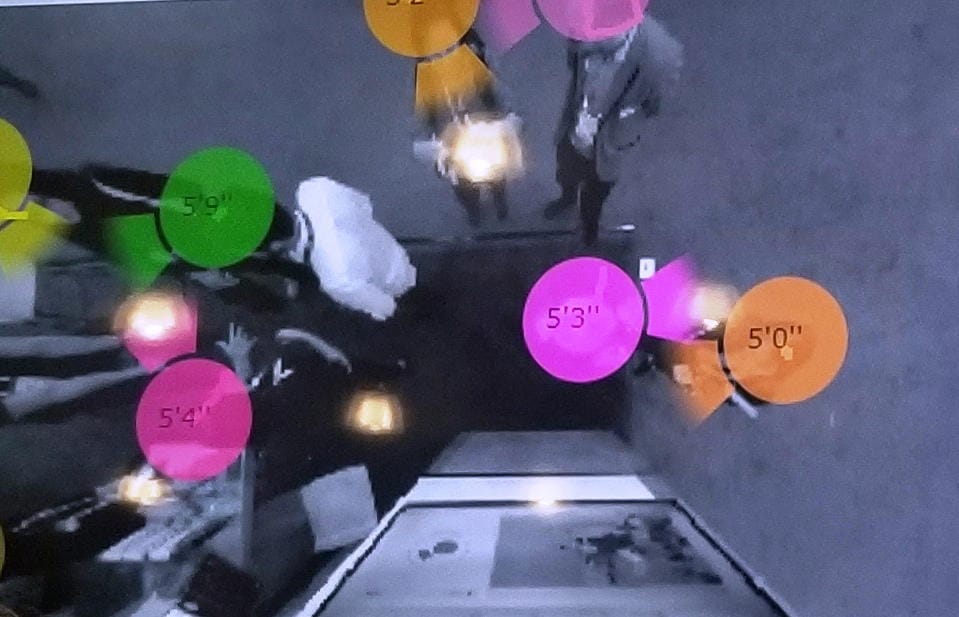
Gaze Rate
Gaze Rate is the percentage of people who *see* the store window or a product on the shelf out of the total number of people who walk nearby.
Click Rate
Online marketing, personalization, and attribution are important in enticing people to visit the store. Retailers also care a lot about loyalty programs and retail media.
In this case, the focus is on a Call-To-Action from Digital Signage. For example, you can measure how often shoppers click on QR. Another example is the sophisticated form of in-store marketing conversion in Smart Carts.
*In-Store Customer Journey* mapping illuminates where customers are (location), if people care about your products (time-based metrics), and if people do what you want them to do (conversions).
Customer Engagement metrics describe targeted behaviors, while Customer Service metrics reflect how the store’s staff influences shopping behaviors.
Customer Service
To quantify customer service, you want to understand where and for how long the staff-customer interaction took place. In other words, you want to understand the value of a direct interaction between the store’s frontline staff and the shoppers.
Again, time-based metrics are especially pertinent for evaluating customer service.
Why?
Time-based metrics illuminate (payroll) costs and benefits of customer service.
For example,
Counter Service Time
Often, “customer service in stores” refers to counter service. It includes processing returns, dealing with problems, and selling lotto tickets.
In call centers, you often measure *Resolution Time* to evaluate customer service efficiency. Many of the concepts used in call centers can be translated to evaluate the performance of in-store counter service.
Salesfloor Service Time
Salesfloor Service (or Frontline Service) refers to the assistance the sales associates provide shoppers. Common in specialty stores, storefront service includes helping customers find products, answering questions, and sometimes, on-the-spot checkout.
Salesfloor service is considered a sales job in apparel and luxury stores. Often, retailers offer commission-based compensation plans for their sales associates.
Time to Greeting
Some retailers mandate that associates greet store visitors within a time frame, such as 60 seconds after potential customers enter the store.
Whether this policy is effective is a matter of debate.
Boring?
Wait. Until. You. See. Time. Studies.
For example, a store associate may spend 79 minutes per shift “folding clothes.” What else would you prefer she do for 16.5% of her payroll cost?
Customer Experience
Customer Engagement is about what customers do, Customer Service is about how employees influence what customers do, and Customer Experience is about how customers feel.
Behavior Analytics translates psychological concepts such as the End-Peak Rule and Loss Aversion into practical policies that can be measured and managed.
For example,
Checkout & Cashier Services: The most direct interactions between employees and customers occur at the checkout tills.
Retail KPIs & Metrics for Checkouts include:
Checkout Time
Checkout Time refers to the end-to-end checkout, including waiting and payments.
Retail executives sometimes use Checkout Time as a KPI—for example, 90 seconds to checkout. Unfortunately, that creates operational challenges because queue formation and cashier services have different influencing factors.
Transaction Time
Transaction Time refers to the duration of processing the items and payment, whether done by a cashier or through self-service.
Transaction Time depends on the number of items, the ease of recognizing or scanning the items, and the speed of payment.
Waiting Time
Waiting Time is the length of time a person stands in line waiting for service.
With advanced tracking technologies, the Waiting Time solutions are more accurate and cost-effective, allowing for Queue Management policies such as “95% of people wait less than 3 minutes.”
Waiting
Waiting is the number of people waiting in line.
Common Queue Management policies include “One in Front,” which refers to a single person waiting in line for service.
The retail KPIs include the metric itself, such as #Waiting, or the policy, such as One in Front. It depends on the sophistication of your queuing solution.
Queue Flow
Queue Flow is the speed at which people exit the line.
Queue Flow is one of my favorite operational metrics because it illuminates staff productivity and ensures the customer has an excellent first-touch or last-touch experience at the checkout.
While managing the checkout process is vital to the customer’s experience because of the Peak-End Rule of Behavior Science, other operational metrics impact how visitors feel about their shopping experience.
For example,
Fitting Rooms Service Rate
Customers who use fitting rooms are much more likely to purchase and buy more than those who just browse the sales floor.
The attendant’s role is often limited to ensuring smooth operations of the fitting rooms, but this practice may change as more smart rooms are introduced in stores.
Bottleneck Rate
Bottleneck Rates reflect how often events, displays, and other factors impact the customer’s flow inside the store. It is a useful metric for in-store marketing.
Abandonment Rate
The Abandonment Rate refers to the number of shopping carts abandoned before checkout and the number of people who leave the queue.
Some considered the Abandonment Rate the “offline equivalent of the online Bounce Rate.” It’s not. Moreover, it is a mistake to use the Abandonment Rate without context.
Response Rate
Rapid Response relates to operational metrics for real-time scenarios, including:
- Trigger Threshold, for example, 5 people waiting in line.
- Alert Rate, for example, maximum 1 alert within 20 minutes.
- Response Rate, for example, how often employees responded to the alert.
Cool.
So far, the metrics and KPIs have addressed customer behaviors and what the store’s employees can do to influence customer behaviors. Next, let’s look at outcomes.
Customer Satisfaction
Brands learn what their customers want through customer surveys, focus groups, and user testing. With AI technology, you can even build your own *synthetic data* sample. And yet, first-party research is still the most effective way to understand customers.
Just ask.
You can run customer surveys directly after purchase, inside the store, or as people exit the store. In-store surveys can be automated in kiosks and tablets like Happy or Not.
Retail KPIs for Customer Satisfaction include:
Customer Satisfaction Score
Customer Satisfaction Score (CSAT) is a much-used KPI to measure how customers feel about products. It is typically a score to a simple question: “How satisfied were you with your experience (in the store, with this perfume or shoe, etc.)?
For example, if you have 25 responses and 20 were “satisfied” and “extremely satisfied,” then the CSAT score would be 80% (20/25×100).
A CSAT score between 75% and 85% is often considered good, but it depends on your store and retail sector.
Net Promoter Score
Net Promoter Score (NPS) is a widely used retail KPI to evaluate customer loyalty and word-of-mouth recommendations.
NPS scores relate to a single question: “On a scale from 0 to 10, how likely are you to recommend our product/service to a friend or colleague?”¹.
Customers with scores of 9 or 10 are promoters, those with 7 or 8 are satisfied but not enthusiastic, and those with 0 to 6 are detractors.
Remember,
Asking people how they feel about a shopping experience or a product increases customer satisfaction because people like to feel *heard*.
Other store KPIs include:
Returning Visitors
Returning Visitors is the number of people returning to the store.
In the online world, Returning Visitors are often tracked using an IP address. In the physical world, you would need to deploy facial recognition. To bypass the privacy regulations, vendors may use facial attributes for Facial Demographics.
Repeat Purchases
Repeat Purchases measure how often customers return to the store to purchase the same product. For example, people who buy cosmetic products tend to return every month. But buying a bed or a car is a one-time purchase.
Churn Rate
Churn Rate is the percentage of people who stopped visiting the store.
Churn Rate is an important KPI for digital subscription products. In physical stores, you can estimate the Churn Rate using customer behaviors. For example, if the store seems too crowded or the queue too slow, people will not enter the store.
Customer Monetization
While Monetization KPIs are covered below, here are selected KPIs in the context of customer behaviors:
Sales Conversion
Sales Conversion is the ratio of buyers to browsers. It answers how many people bought something in the store out of all visitors.
The formula is:
% Sales Conversion = # Transactions / # Visitors
Sales Conversion is a versatile KPI that often serves as a Target Outcome during in-store experiments and retail analytics.
Average Order Value
Average Order Value (AOV) is a retail KPI that measures the average amount customers spend per transaction. It tracks the potential sales value per customer.
$ Average Order Value = $ Revenue / # Transactions
For example, if the store had $100,000 in revenue from 2,000 orders, the AVO would be $50 ($100,000/#2000). It means that, on average, each customer spent $50 per visit.
Easy.
The most important customer KPI for retailers is probably the Customer Lifetime Value.
Customer Lifetime Value
Customer Lifetime Value (CLV) represents the predictive total revenue a customer will bring during their entire relationship with the retailer.
Here’s the formula:
Customer Lifetime Value (CLV) = Average Order Value × Frequency × Lifetime
For example, if a customer buys groceries every week and spends, on average, $100 per visit, and it is estimated that she will return to the store for the next 10 years, then the CLV is $52,000 ($100AOV x 52 weeks x 10 years)
One of the most promising areas of behavior analytics is investigating different ways to understand how to calculate CLV better.
For example, buying cosmetics tends to be a (habit-based) monthly purchase. On the other hand, purchasing a washer and dryer, a car, or an expensive handbag is a one-time purchase.
Insights into why we buy help retailers to understand better the costs of acquiring customers and their potential future revenue.
The fun begins when you work with cross-sells and upsells. In other words, you are trying to see how products influence each other.
Product Positioning with In-Store Lifecycle
Every product decision is a bet.
Most product decisions are made months before the product arrives at the store. The store tells us if we correctly choose products and how to sell more.
When people enter the physical store, they have a *higher interest in buying* than those who do not. In marketing parlance, these people are higher in the purchase funnel.
The financial outcomes of product decisions play out in the store.
Product KPIs and metrics tell retailers how many products were sold at what price and whether the products should be transferred or sold in liquidity. Sales data illuminates if products align with customers’ expectations of the brand.
Retail KPIs for Product Success
To retailers, the store is a phenomenal feedback environment where they can learn what works and where opportunities for improvement exist.
For example,
Inventory Turnover Rate
Inventory Turnover Rate refers to the number of times the store sold inventory within a specific period. The formula is:
Inventory Turnover = Cost of Goods Sold / Average Inventory
For example, if the store has an average inventory of $50,000 and the annual COGS is $300,000, the Inventory Turnover is 6. ($300,000/$50,000=6)
A too-low inventory turnover rate means you are not selling fast enough and may get stuck with unwanted products. A too-fast inventory turnover rate means you are not selling fast enough to meet customer demand.
The Inventory Turnover Rate is a vital planning KPI, but if you want to know how you are progressing, use the Sell-Through Rate.
[#BehaviorAnalytics #SellThrough image]
Sell-Through Rate
The Sell-Through Rate tells you how fast products are sold. In other words, it is the percentage of items sold to the number of items available. The formula is:
Sell-Through Rate = # Units Sold / # Beginning Inventory x 100
For example, if the store got 100 bags at the beginning of the Back-to-School season and sold 57 bags by the end of the season, the Sell-Though Rate is 57% (57/100=57%)
A too-low Sell-Though Rate suggests that you probably need a promotion or price discount to move the products faster. A too-high rate indicates that demand is higher than expected, and you order more products.
Product Life Cycle
Product Life Cycle has four stages: introduction, growth, maturity, and decline. Here are retail metrics about product lifecycle:
Sales by Product Age
When you walk into a store, you can sometimes clearly see the product life cycle at work. In apparel stores, for example, new products are located at the storefront, while the products in decline are in the clearance aisles.
For example, you can compare:
- Sales of new products to established ones.
- Sales of the same product over time.
- Sales of products by in-store zone.
Sales by Stock Keeping Units (SKUs)
Merchandising managers are responsible for allocating SKUs in products and product categories. The number of products placed in physical stores affects layouts, customer behaviors, and inventory management. Specifically, SKU counts impact Shelf Space and Assortment Optimization.
For example,
If you have a business suit collection with 2 colors × 2 styles × 4 sizes = 16 unique product variations, your SKU count would be 16.
The number of SKUs varies significantly depending on the store’s size, format, and product categories, from 5,000 in an apparel store to 60,000 in supermarkets.
Retailers aspire to design product assortments consistent with consumer choice, space constraints, and operational complexity.
Product Return Rate
Product Return Rate is a retail KPI that measures the ratio of products that customers returned out of product sold.
For example, if a store sells 1,000 products in a month and 50 of those products are returned, the product return rate would be 5% (50/1000×100)
Return Rate has a significant impact on profitability. In 2022, consumers returned over $603 Billion worth of merchandise.
The most problematic factor in returns is fraud, but damaged products, inaccurate item descriptions, and sizing (for apparel) issues are common reasons for returns.
Next, you want to know how to move products faster.
Product Positioning
Product Positioning covers the four Ps of marketing: product, placement, promotion, and pricing. In Behavior Analytics, the focus is on what’s happening inside the store.
Product Conversion Rates
Conversion Rates track the percentage of people who take the desired action. In other words, conversion rates measure the success of your call to action. The formula is:
Conversion Rate = # of people who acted / # of people in the location
For example, if you run a promotion and the call to action is to purchase Allergy Medicine and sell 5 bottles out of 7, the conversion rate is 71.4% (5/7=71.4%)
Conversion Rate is probably the most effective yet misunderstood KPI in retail.
Product Placement Scores
You use product placement metrics to evaluate the strategic placement of products within the store, category, and shelf.
For example,
- Visibility Score: Did customers see the product?
- Complexity Score: Did customers understand the product?
- 5-Second Testing: What did customers remember?
[image Source Mike McMillan]
Product Pricing
Product pricing is a huge topic in Behavior Analytics – because price represents the value of the product to the customer – and it deserves its own section.
Retail KPIs that illuminate product pricing are:
Gross Profit Margin
Gross Profit Margin is the money left after costs are deducted from revenue. It shows if selling the product is sustainable, in other words, profitable.
The formula is:
Gross Profit Margin = (Revenue – Cost of Goods Sold) / Revenue x 100
For example, if the product costs $10 and you sell it for $25, the Gross Profit Margin will be 60% ($25-$10)/$25×100=60%).
Net Profit Margin
Net Profit Margins include other business expenses such as administrative costs, utilities, insurance, etc.
For example, if a supermarket is like many other grocery chains operating on razor-thin profit margins, your Net Profit is $3,000 on $100,000 of sales or 3%.
Products with positive profit margins make you money. Those with negative profit margins don’t.
Product Markup Rate
Margin and Markup are two sides of the same coin.
The Gross Margin Rate represents the leftover profits after the Cost of Goods is deducted from the sales price. Markup Rate shows profit as it relates to the Cost of Goods.
Simply put,
The margin is the leftover profit, while markup is the sales price calculated of cost.
Product Markup Rate is the percentage increase above cost that calculates the sales price. The formula is:
Markup = Profit / Cost x 100
For example, if a product cost is $10 and you are selling it for $25, the markup is 150% ($15/$10×100=150%)
Many retailers use 50% or 60% markups, but markups vary widely depending on the retail sector, store location, and product. For example, luxury bags have significantly higher markups than a toaster.
Price Sensitivity Rate
Price Sensitivity refers to the extent to which consumer purchasing behavior changes based on product prices. Price Sensitivity considerably influences sales and profits and, therefore, plays an important role in Behavior Analytics.
In economics, the term is Demand Elasticity. In other words, there is a direct relationship between price and demand for retail products.
For example, say you design a marketing promotion offering a 10% discount. In return, you expect an increase in sales of 20 units. If the promotion is for 20%, you only expect an increase in sales of 30 units.
High elasticity means small price increases would significantly reduce demand. Low elasticity means that price discounts may not significantly impact sales.
Price sensitivity varies between brands, products, categories, and individuals. For example, consumers who value high-quality luxury products tend to be less price-sensitive than those who shop at Costco.
Operations KPIs for Retail Stores
Store Operation is the engine that drives the store to succeed financially, be a great workplace, and serve as the brand magnet to customers.
Many retailers still consider the brick-and-mortar store a tactical sales floor. In that sense, Store VPs are the masters of operations.
That’s too bad,
Because the store is so much more.
In Behavior Analytics, getting store operations done right is the *secret sauce* to influencing customer behaviors, managing employees, and turning stores into sustainable and profitable businesses.
Store Operations consist of five core functions: managing employees, servicing customers, doing what needs to be done, dealing with problems, and maintenance.
Customer Service
In Behavior Analytics, you work with Targeted Behaviors and Influencing Behaviors. Specifically, customer service operations reflect how the specific service will influence customer behaviors.
Customer service metrics are often used with time-based metrics to evaluate service interactions and quality and serve as outcomes for Store Optimizers.
Service Intensity
Service Intensity is the customer-to-staff ratio in a retail store or service environment. It is a descriptive metric that reflects how many customers an associate could serve.
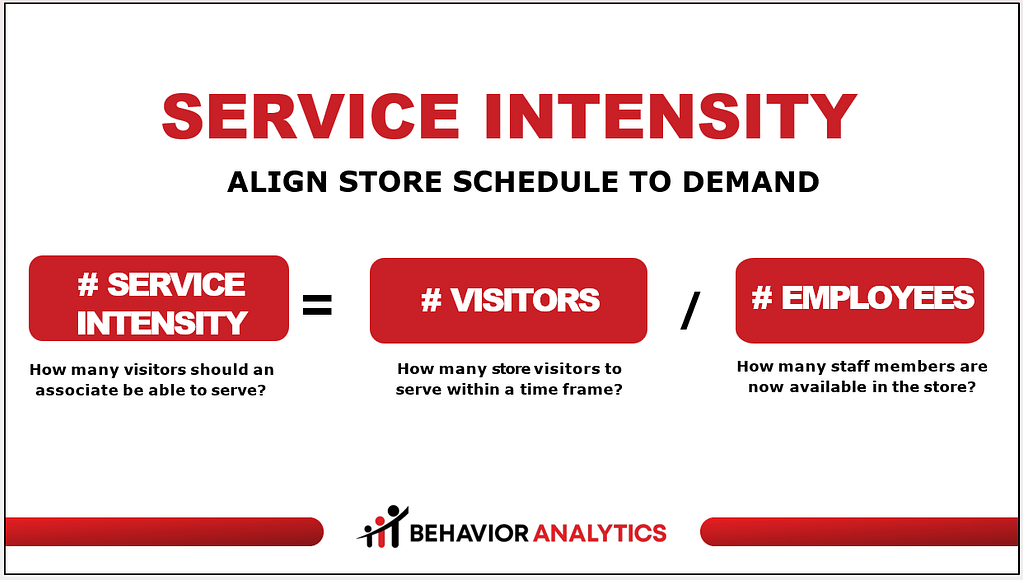
For example,
If 50 people visit the store during lunchtime and you want a 5:1 service intensity ratio, you would schedule 10 employees to cover the checkout, stock products, and help shoppers.
Service Intensity guides scheduling policies regarding the number of in-store associates required to accommodate a Customer Service model.
Service Target
Service Target is the specific goal of customer service the retail organization sets.
For example, the Service Target is often a numeric range. A typical range is 18 to 25 for Big Box stores and 3 to 7 for small specialty stores.
Service Occupancy
Service Occupancy is the customer-to-staff ratio in a specific zone or department. For example, the store’s current occupancy is 21 customers and 3 associates.
Service Occupancy is important for service-oriented retailers such as electronics and luxury retailers. Sometimes, service occupancy is used in queue management.
Technically, Occupancy can be a calculated formula using foot traffic or objects in the zone during the timeframe. It depends on your people-tracking solution.
Service Density
Service Density refers to the concentration of people within the zone, such as the number of people per square foot.
For example, a book reading event requires a zone with a service density of 20 people.
Service Productivity
Service Productivity is an advanced KPI that connects the Service Intensity targets, actual demand (footfall traffic), and sales (Sales per Hour) for individual employees.
Service Outliers
Service Outliers refer to irregular events. The Outlier Rate is especially important when designing service policies.
For example, if you are contemplating a policy of serving 95% or 98% of people in less than 3 minutes, the Outlier Rate will help you determine the potential impact of each customer service policy.
Service Success Rate
The Service Success Rate, also known as the Service Level Ratio or Service Level Measurement, is the percentage of successful service events out of all events.
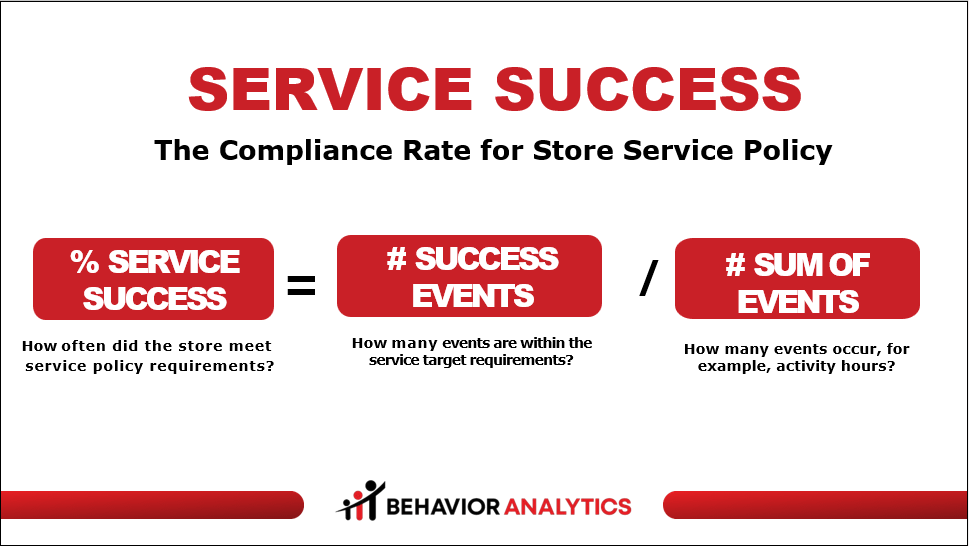
Service Level is a performance metric that quantifies how well the local store met the requirements of the retailer’s policies for Service Intensity.
For example, if the local store had 22 out of 91 activity hours during which the Service Intensity met the requirements of the Service Target, the Service Level would be 24%.
Workforce Management
Optimizing workforce planning is crucial for retailers. Much of the workforce planning is done at a corporate level, usually by a specialized workforce manager. Store Managers, however, often recruit and manage the local employees.
To clarify,
You should think about the retail workforce metrics in the context of corporate planning and local store alignment.
For example,
Sales per Hour
Sales per Hour is a KPI that measures staff productivity, compares individual skills, and asses upselling opportunities. It refers to the revenue generated in one hour.
For example, if the store’s daily revenue is $5,000, with 5 employees working, and the store is open for 10 hours, the Sales per Hour per employee is $50 (5,000/(5×10))
Payroll Hours
Payroll Hours refers to cost allocation for employees. In retail, allocating payroll hours as a ratio of store sales is common.
Workforce Metrics
Retail KPIs for Workforce Management include
- Attrition Rate: the percentage of employees leaving the company voluntarily due to resignation, retirement, health, better jobs, etc.
- Turnover Rate: the percentage of all employees leaving the company, whether voluntary or non-voluntary. A high turnover rate signals a toxic work culture.
- Retention Rate: The inverse of turnover measures how well your company retains employees. In other words, it captures how attractive the company is to employees.
These are important metrics.
And yet,
The insights on how to improve store performance are often missed.
In Behavior Analytics, you identify alignments between workforce planning and the local store environment. You think strategically.
For example,
Real-Time Management
A unique case of workforce management is what happens in real-time, in the local store, in the minute-by-minute decisions made by Store Managers.
“Get the Right People in the Right Place at the Right Time.”
Many retailers use real-time management to monitor inventory and stockouts in stores. In Behavior Analytics, you are focusing on Rapid Response.
In other words, you care about responding to events.
Rapid Response
Real-Time Management describes what happens. Rapid Response is about what store managers can do right now.
Rapid Response is a program that identifies event triggers, sends alert messages, and articulates the best response considering the environment. As a Store Optimizer, you build service models and monitor their results.
For example,
- “One in Front” for Queue Management with #Waiting.
- “Wait less than 3 Minutes” for time-based Queue Management.
- Greet Arrivals in less than 60 seconds.
- Optimal Service Time of 90 to 360 seconds.
- Queue Flow of 180 seconds or less.
A special case of Rapid Response relates to Queue Management.
Queue Management
Often, the most direct interaction between customers and employees occurs during the checkout process. Retailers pay attention to queues because the checkout experience is considered the highest friction point in the path to purchase.
Waiting
Waiting refers to the number of people waiting in line for a service or an experience. The KPI can be technically adapted to individuals or shopping groups.
There are different types of queues. For example, 10 people could be waiting in a linear line, 5 people waiting in 2 parallel lines, or a distribution of 3, 3, and 4 people waiting in various queues.
Waiting Time
Waiting Time refers to the duration people wait in line, from the point of entry to the point of exit.
You should use Waiting Time instead of Waiting as your primary KPI because people react more positively to speed than crowds. You probably experienced this emotion yourself if you stood in the long lines at Disneyworld.
Transaction Time
Transaction Time is the duration of the payment process. It depends on the number of items in the transaction, the payment process, and the cashier.
Checkout Time
Checkout Time is the duration a person stays in the checkout zone, including Waiting Time and Transaction Time.
Some retail executives target Checkout Time, which is challenging for store operations because Transaction Time depends on customer behaviors, while Waiting Time relies on the number of active cashiers.
Queue Flow
The KPI *Queue Flow* is the duration of exiting the queue.
Sadly, the *Queue Flow* is one of the most awesome and misunderstood KPIs. It depends on how you structure the order and preparation process and is not dependent on the number of cashiers.
When retailers talk about store operations, they often think about task compliance.
Task Compliance
Task Compliance in stores refers to adhering to external laws and internal requirements. Depending on the task, non-compliance may have legal ramifications, such as lost trust from customers and suppliers and employee backlash.
In addition to the product and inventory metrics covered in previous sections, you also track the following:
Stockout Rate
Stockout Rate—also known as out-of-stock—measures how often items are out of stock. For example, if a product is out of stock much faster than forecast, you might have the beginning of a trend.
To store optimizers, stockout rates also identify whether the problem is in the supply chain (because of Supply or demand forecasting) or local store operations.
Reorder Point:
Reorder Point is the inventory level at which you should reorder products. Because you are looking for trends, this is a good indication of the product’s sales viability.
Planogram Compliance
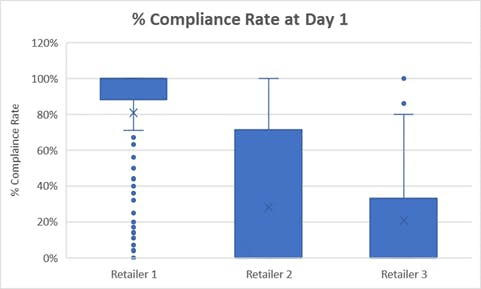
A planogram is a visual representation that shows how and where retail products should be placed on shelves or displays. The Planogram Compliance Rate measures whether the store fulfilled the planogram requirements correctly and on time.
For example,
In the Box-and-Whiskers below, Retailer 1 had around 90% planogram compliance, while Retailer 3 had a compliance rate below 20%.
Loss Prevention
Loss Prevention is the discipline of guarding profits by preventing losses due to theft, errors, and other factors. Retailers lose about 1.6% of their income due to administrative errors, employee theft, vendor fraud, shoplifting, and organized crime.
For example, retail KPIs for loss prevention are:
Shrink Rate
The term *Shrink* refers to the difference between merchandise a retailer records in the inventory system and the actual physical count of the merchandise sold. The Shrink Rate is the ratio between what inventory should be and the actual inventory in the store.
Advances in RFID solutions have significantly reduced the complexity and costs of tracking inventory, out-of-stock items, and shrink rates. It allows Store Optimizers to develop new techniques to reduce shrinkage, for example, at self-service kiosks.
Theft Rate
Theft Rate relates to different thefts in physical stores, such as employee theft, gift card fraud, and shoplifting.
Return Fraud Rate
Returned Fraud Rate relates to illegitimate product returns. Omnichannel models such as Buy Online Pickup in the Store (BOPIS) significantly increased the theft opportunities from fraudulent returns.
Site Maintenance
Site Maintenance includes various activities, including upkeep of fire alarms, parking lots, refrigerator servicing, and energy control. The goal is to ensure efficient and safe operation and provide a positive customer experience.
In Behavior Analytics, you care about ongoing activities.
For example,
- Maintenance Costs per Square Foot: The cost of maintaining the location according to the store’s size.
- Downtime Rate: It measures the duration the store is out of operation due to maintenance or safety incidents.
- Cleanliness Score: This metric, often measured with mystery shopper surveys, reflects the state of cleaning floors, restrooms, display areas, and store windows.
Store Operations can be viewed as having employees stock shelves and clean floors as customers aimlessly browse the aisles or as a growth engine.
Monetization KPIs as Outcome Success for Retail Stores
“Our target is to increase sales by 5%.”
Of course, you do.
However, these declarations by retail executives are outcome statements. What matters is what you do, assuming it will result in that target outcome.
In Behavior Analytics, the outcomes are directly related to the hypothesis of what is the targeted behavior, the influencing behaviors, and the context of the local environment.
Previous sections covered retail KPIs related to customers, products, and operations. This section covers common financial KPIs.
Store Financial KPIs
The standard retail store KPIs are the metrics that reflect financial outcomes.
For example,
Comparable Sales
Year-over-year comparable store sales, often called “comps,” are a crucial KPI in retail.
The Comps KPI compares sales performance in the current period to the same period in the previous year. It is especially relevant for stores operating for at least a year to track decline or growth.
For example,
If a store’s revenue was $1,000,000 this year and $950,000 the previous year, the YOY Comp Rate is 5.26% ($50,000/$950,00×100).
Another big challenge is the difference between sales and profits. Sales give you a short-term boost and survival mode, while profits last in the long game.
Gross Profit Margin
Gross Profit Margin tracks how much revenue the company keeps after deducting product creation and sales costs. Financially speaking, it measures the percentage of income that exceeds the cost of goods sold (COGS).
For example,
If a store has $500,000 in revenue and $300,000 in COGS, the Gross Profit Margin is 40% ((500,000 – 300,000)/(500,000) x 100)
Net Profit Margin
Net profit is the profit earned after all business expenses are accounted for. The formula for Net Profit is:
Net profit = Gross Profit – Operating Expenses – Other Business Expenses – Taxes – Interest on Debt + Other Income.
Net Profit Margin indicates the percentage of revenue that remains as profit after all expenses are deducted.
For example,
If a store has $500,000 in revenue and $50,000 in net profit, the Net Profit Margin is 10% ($50,000/$500,00×100)
Store Operational KPIs
In the case of financial KPIs related to store operations, you want to know if the investment created value and had an impact on outcomes.
Return on Investment
Return on Investment (ROI) measures the profitability of an investment by comparing the net profit to the cost of the investment.
For example, if you invested $10,000 in a tracking solution and it generated insights that increased sales by $15,000, your ROI would be 50%.
Return on Assets
Return on Assets (ROA) indicates how profitable a company is relative to its total assets. It measures how efficiently a company uses its assets to generate profit.
For example, if the store has a net income of $200,000 and inventory worth $2,000,000, the ROA would be 10% ($200,000/$2,000,000)
Operating Margin
Operating margin measures the percentage of revenue after covering the store’s operating expenses, such as store leasing and maintenance, labor, and inventory.
For example, if the store has $500,000 in revenue and $100,000 in operating income, the operating margin is 20% ($100,000/$500,000×100)
Retail KPIs Examples for *Store Optimizers*
In Behavior Analytics, the focus is on designing in-store experiments that will help to improve store performance. You are looking for inputs that have the most significant impact on achieving your desired outcomes.
Here’s an example of a framework:
WIN-WIN-WIN ALIGNMENT: THE [BUSINESS USER] WANTS TO ACHIEVE AN [OUTCOME] BY MANAGING A [BEHAVIOR] WITH [TECHNOLOGY SOLUTION]
In physical stores, three influencing factors carry significant costs: real estate, inventory, and workforce. Below are examples of how to use retail KPIs with the framework:
Examples of Outcome KPIs for Customer Behaviors
In Behavior Analytics, customer behaviors evolve around five core questions: who they are, where they are, how long they store, what they do, and which specific behavior you want to target.
For example,
- A store manager for a cosmetics chain wants to increase the number of Store Visitors by 5% by tracking Proximity Traffic and Capture Rate in the Mall Store.
- A store manager wants to increase customer engagement and achieve a 5% Sales Boost by placing this season’s boots in the Storefront Display.
- A product manager wants a 5% sales uplift for the high-end bags zone in a luxury store with Path Analytics.
Examples of Outcome KPIs for Product Positioning
While every product decision is a bet, and you cannot control luck, you can and should develop the skills to use product metrics to understand why products sell and how to sell them more profitably.
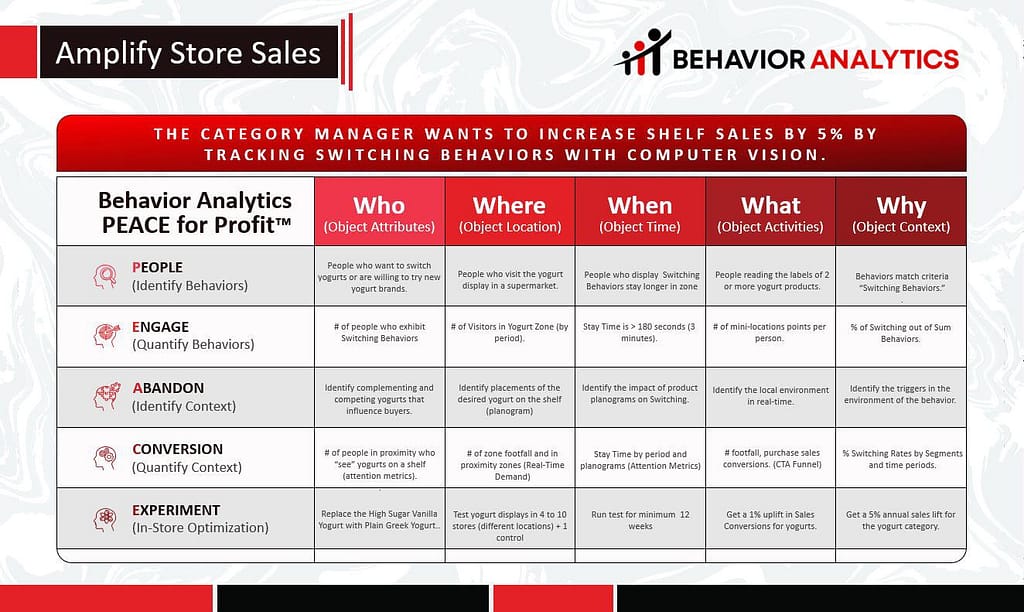
- A category manager wants to increase shelf sales by 5% by tracking customer switching behaviors with computer vision.
- A brand manager wants to sell 100 facial creams with Impulse Behaviors using a 30% discount in a 3-day promo.
- A store designer wants to optimize sales in the clearance aisle by scoring the effectiveness of the customer’s field of view on the position of the displays.
Examples of Outcome KPIs for Store Operations
In Behavior Analytics, the goal is to empower employees to be “in the right place at the right time” and focus on what would create the most impact on store performance.
For example,
- The workforce manager wants to improve the customer experience score by scheduling to service intensity with a service success ratio of 90% or more.
- The merchandising manager wants to increase planogram compliance to 95% by managing logins and tasks with a planogram management solution.
- The loss prevention manager wants to prevent in-store theft by responding to suspicious loitering behaviors within 1 minute in 99% of events.
Amplify Store Performance
Store Optimizers design in-store experiments using Location, Customers, Employee Outcomes, and Monetization KPIs.
The quantified insights illustrate a relationship between influencing and targeted behaviors, allowing you to improve store performance step-by-step.
Awesome.
