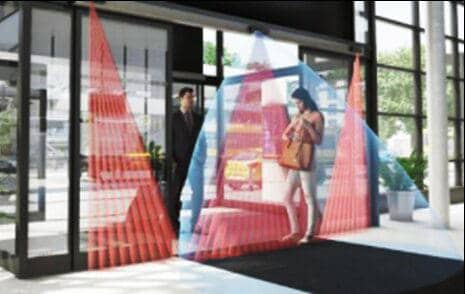
People counting systems capture people passing a virtual line using foot traffic sensors.
Footfall traffic quantifies the sales opportunity. For example, the data from a person counter at the door is the retail KPI of Visitors.
In other words,
You count the number of people entering and exiting. You deploy in stores, malls, venues, banks, airports, buildings, or any physical location.
The benefits come from the segmentation of the physical locations. You analyze by foot traffic trends and store performance.
And,
With retail location data, you optimize store operations, labor productivity, and marketing analytics.
Most important,
The accuracy of people counting sensors depends on the technology and audits. You can do more with accurate footfall data.
For example,
You
During the Covid-19 pandemic, you complied with social distancing mandates with real-time occupancy.
In this post, you’ll learn how to:
- Identify applications for foot traffic
- Segment & compare stores
- Work with retail stores KPIs
- Use real-time occupancy
- Choose people counting sensors
Let’s dive right in.
The Growth of People Counting Technologies & Markets
According to Markets and Markets, the people counting market will grow from $810 million in 2020 to $1.3 Billion by 2025.
You might be confused with terminologies such as people counting, footfall, foot traffic, sensors, cameras, traffic counters, customer counters, visitor counters, and door counters.
Let’s sort it out:
What’s People Counting
People counting refer to the technology solutions that count people crossing a line.
Counting sensors could be camera-based, thermal, weight sensors, wireless trackers such as WiFi. Any technology that detects objects is a people counter.
Foot traffic data includes location, duration, and direction.
The line could be physical or virtual. It can represent the main entrance to a physical store, a door to a shopping center, or an in-store zone.
Counting people is essential to retailers because foot traffic correlates with sales. In other words, more traffic, more sales.
How People Counting Works
A people counter detects objects, recognizes people, and sums up the number of people.
The step-by-step process of a person counter is:
- Detection: the system detects an object or not.
- Recognition: the system recognizes the object as a person or not.
- Analytics: the system assembles the raw data into a metrics table.
Once the sensor collected the data, the output is a set of data fields. For example, #Arrivals between 10:15 am to 10:30 am is 17 people.
The sensor sends the data fields to a central server using the internet or VPN in batch uploads.
The central server could perform analytical functions. It pushes reporting and interactive dashboards.
Foot traffic data may be part of a much larger data platform.
The specific people counting process depends on the technology, network, and solution architecture.
What’s a door counter
A door counter is a counting sensor mounted above the door. The technology may be a camera-based sensor, a thermal sensor, or a WiFi access point.
Door counters could also be a counting sensor embedded in the door itself.
What’s a footfall sensor
Footfall is the British word for foot traffic. You’ll talk about footfall sensors in the United Kingdom and Australia.
What’s “good” foot traffic
It depends. You define “good” foot traffic in context to location, proximity traffic, and benchmarks.
Most important, “good” foot traffic is a level that aligns with your forecasts.
How accurate are people counters
Accuracy is a function of the technology, solution, and data structure. Most important, accuracy depends on the design of the audit.
Ignore vendor statements such as “the world’s most accurate counters” and “98% accuracy”. The value of accuracy is irrelevant without the clarity and transparency of audits.
How do you measure foot traffic
A counting tracker captures objects passing a virtual line. Each time the system recognizes the object as a “person,” and it adds a count.
How is mall traffic calculated
To count mall traffic, you deploy counting sensors at each entry point.
You calculate mall traffic as a sum of all people entering the shopping center, in all doors, per period.
What are traffic counters used for
Foot traffic counters generate data on visitors to a physical location or a virtual zone.
With people counting, location managers know how many people use their physical facilities. They know “when” and “where.”
For example, the metric “Visitors” clarifies the border between online and offline activities. Marketing promotions drive traffic to the store. But store operations convert browsers to buyers.
Most important,
For retailers, the benefits include actionable insights on store opportunity, operations, and performance.
Here’s why:
The Self-Fulfilling Prophecy of Transactions
Often, there’s confusion between input and outcome metrics.
The standard method to measure store performance is to use sales data.
Why?
It’s easy to use transaction data. The point-of-sale systems are already deployed in the store to process payments.
But in retail, “sales” is an outcome KPI.
Case Study: The tale of two stores below shows how retailers can trap themselves.
In this example,
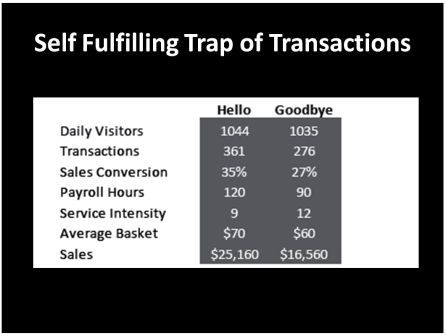
The Hello and Goodbye stores sell apparel and accessories and are part of the same retail chain.
The two stores serve similar trade markets. Both stores operate with similar consumer demographics and income levels. The locations of the stores are open-air shopping centers.
The stores are 20 minutes away from each other.
If you had only sales data, store performance is evident. With $25,160, the Hello store has almost double the daily sales of Goodbye at $16,560.
If you only had point-of-sale data, Hello is better in other aspects as well. The average basket in the Hello store is higher than Goodbye. And Hello has more transactions.
The relative success of Hello has direct implications on inventory, scheduling, and compensation.
But,
Once you add the foot traffic data, it is evident that the two stores have the same sales potential.
The demographics, geography, and foot traffic say the stores should perform the same.
The data provides clues to the disparity in sales.
For example, the sales conversion in Goodbye is lower than in Hello, with 27% to 35%.
It means the Goodbye store does not convert as many visitors to buyers.
Why?
The corporate office may not allocate as many items to the Goodbye store as to Hello. That will cement its less-performing status.
And,
Hello has 120 payroll hours while Goodbye has only 90. Often Workforce Management Systems (WFM) schedules payroll hours based on sales. As a result, Goodbye does not have an adequate level of staff.
In “high-touch” retailers such as luxury and electronics stores, service is critical. You can immediately see the scheduling distortion in the metric of Service Intensity
The story of Goodbye is fictional. And yet, almost every door-counting project has these scenarios.
A senior executive once summarized such a store with “we did this to ourselves.”
Here’s another example.
Case Study: How Sales Results Can Mask Good In-Store Performance.
Using only sales results can mask true store performance.
Here’s a case study from Headcount:
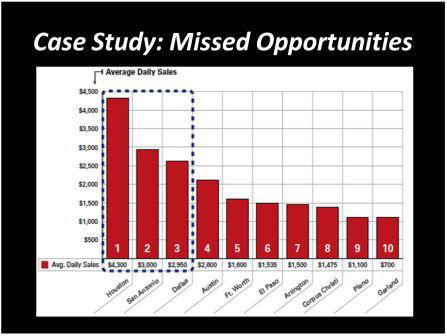
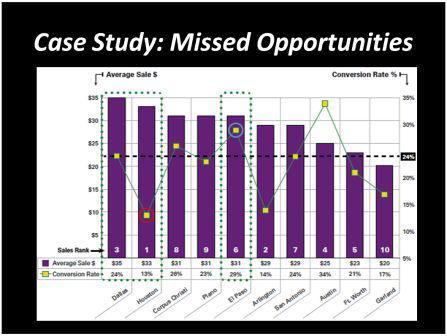
The chart shows the average daily sales of apparel stores in Texas, in a linear rank from high to low. The Huston store is #1 in sales (left).
But,
Once you added average tickets and conversion rate, the ranking changed.
The #1 store ranked in sales also has a high average ticket value but a low conversion rate. That’s also true for the #3 Dallas store.
You can assume the high average ticket is the driving factor beyond the sales results in the #1 Huston and #3 Dallas.
So,
Sales conversion and average order value are good retail KPIs for store operational performance.
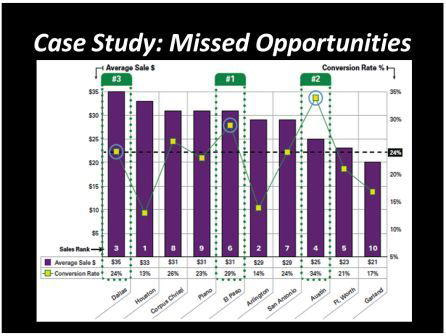
The store with the best performance is #6 El Paso.
The #6 store has a high average ticket and high conversion rate. The reason for the lower sales results is foot traffic.
In other words, the #6 El Paso store had fewer sales opportunities. At the same time, the store performed than stores #1 and #3.
Here’s the critical point:
Stores don’t control traffic, but they control what happens inside the store.
So,
How do you work with foot traffic data?
Foot Traffic Analytics: Applications for Retail, Malls & Physical Locations
Counting people visiting a physical location has different business benefits for various sectors.
For example,
In sectors such as apparel and electronics, the sales conversion rate is the primary benefit. Also, foot traffic data helps to optimize staff scheduling.
In destination retail and malls, foot traffic is a measure of demand trends. For example, retailers use foot traffic to measure the effectiveness of marketing promotions. And mall management includes foot traffic data in leases and tenants’ mix.
In venues such as stadiums and museums, you test for occupancy capacity and customer flow. In transportation hubs, foot traffic analytics is a part of resource allocations.
In supermarkets, people counting technologies are part of a queue management solution.
You can categorize the benefits into the three core areas of retail store management:
Store Operations
Measure, manage and improve store operations.
For example:
- Predict traffic trends to improve the accuracy of demand forecasting
- Measure store performance with sales conversion rates
- Track proximity traffic and capture rates for physical stores
Labor Productivity
Improve labor productivity and staff satisfaction by including foot traffic.
For example:
- Optimization of workforce scheduling
- Track compliance of task management
- Manage customer service in real-time
Store Optimization
Optimize store conversions, marketing, and layouts to increase profits.
For example,
- Marketing effectiveness: store windows, entrance displays, in-store fixtures, digital media, and in-store marketing
- Shopping behaviors: fitting rooms, displays, layouts, and other in-store zones
- Customer service: optimal service time, in-store conversion rates, and product placement.
Today, people counting technologies are a sub-category of robust people-tracking markets.
A word of caution:
People Counting is sometimes mistaken for Location Intelligence, Demand Analytics, and Location-Based Marketing.
While the terminologies also refer to foot traffic analytics, the technologies are different.
That said,
Let’s go back to the foundations.
Retail KPIs: Key Performance Indicators for Physical Stores
Key Performance Indicators are metrics that matter.
Retail KPIs relate to store performance in sales, product, workforce, operations, and demand.
Most retail costs in real estate, supply chain, and workforce are long-term investments. So, store performance matters.
And,
Foot traffic represents the store opportunity.
Traffic data clarifies the line between corporate marketing and store operations. Marketing has the responsibility to bring people to the store. And store operations have the task of converting browsers to buyers.
In other words,
Retail location KPIs measure the transformation of the sales opportunity into actual revenue.
How?
The Sales Formula
Sales are a function of foot traffic, conversion rate, and average ticket.
Sales = Visitors x Conversion Rate x Average Order Value
To increase sales, you need to improve the sales opportunity and store performance.
The sales opportunity is a function of geography, marketing, and proximity traffic.
The average ticket and sales conversion are a function of store operations. As a retailer, you control store design, product inventory, and labor productivity.
For example,
To increase the average order value, you train the associates to cross-sell and up-sell.
And,
You train associates to “get one more customer in the next hour.”
Winning retailers understand the average order value and conversion rates are not exclusive. So, it’s essential to include all three input factors in evaluating store performance.
Here’s the key:
To manage stores, differentiate between outcome and input metrics.
For example,
These “sales” metrics offer a picture of the store opportunity and store operations:
1. Comp Sales
Comp Sales refers to Year-Over-Year Sales Comparison of the same store. It points to the change in the financial performance of the physical store.
But the rise of Omnichannel creates a challenge in evaluating bricks-and-mortar stores. If you order online and pick it up in the store, it will distort the value of Comp Sales.
More important,
Comp Sales is an outcome metric. It excludes profits and the opportunity that correlates with foot traffic.
2. Sales for Square Foot
Sales Per Square Foot (SPF) is the average revenue for every square foot of the sales floor.
SPF matters in evaluating store layouts, product categories, and Experiential Retail.
And yet,
SPF works best in context with in-store customer analytics.
3. (Foot Traffic) Visitors
Often, people counting sensors are door counters. “Visitors” reflects the number of potential customers who entered the store.
But
Analytics starts with the data structure.
In location analytics, the data output depends on technology and solution. There is a wide variety of technical ways to define the counts.
To define “Visitors”:
- Counting: Use the number of “Arrivals” for reporting and forecasting. Pick the metric “Existing” for operational analysis.
- Period: Often, the people counts are in 15 minutes intervals. Store managers use daily totals and intra-day periods. And managers work with daily, weekly, and year-over-year comparisons.
- Comparing foot traffic: Most retail stores have weekly trends. So, you should compare daily traffic trends to the previous week. For example, a Tuesday compares to the previous Tuesday.
With advanced technologies, you divide traffic data into three categories:
- Visitors: the number of people crossing a virtual line per period.
- Customers: the number of people entering a store, excluding staff.
- Shopping Groups: groups are two people or more in proximity.
“Visitors” is a versatile retail KPI
How you define the counting impacts forecasting, operations, and compensation plans using sales conversion.
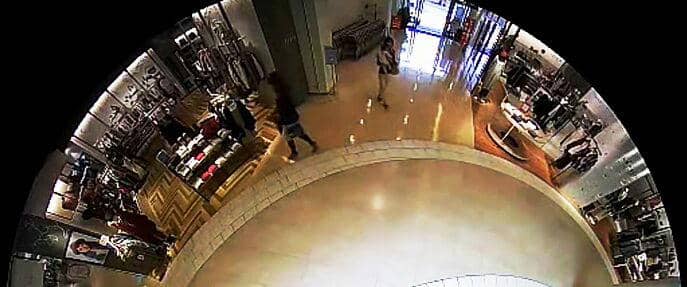
Foot traffic is a picture of store opportunity. But the value of counting people is actionable insights for improving store operations.
For example,
4. Sales Conversion Rate
Sales Conversion is the ratio between buyers and browsers. It represents the ability of the store to translate sales opportunities into revenue.
Sales Conversion quantifies the ability to convert store visitors into buyers.
Sales = Visitors x Conversion Rate x Average Order Value
Often, you use the metric sales conversion in comparing stores.
5. Service Intensity.
Service Intensity is also known as the Customers to Staff ratio.
A Service Intensity of five means that a single associate may serve five visitors at the same period.
In other words, Service Intensity is a measure of customer service.
6. Store Dwell Time (Duration)
Store Dwell Time refers to the average time in the store.
Often, the metric is an average of duration. It’s a sample of personal trackers such as smartphones with WiFi or GPS.
Time-based metrics are essential tools for in-store optimization.
7. Proximity Traffic
Proximity Traffic refers to the number of people walking close to the store. For example, proximity traffic refers to people walking within two feet of the store’s window.
The system measures the proximity traffic when the counting sensor tilted outside.
Segmentation: The Step-by Step Process to Compare Retail Stores
With people counting, you segment stores and identify winners and laggards.
Here’s why:
- Segmentation improved the effectiveness of location analytics
- Winners point to best practices that optimize sales and profits
- Laggards are non-performing stores that need immediate attention
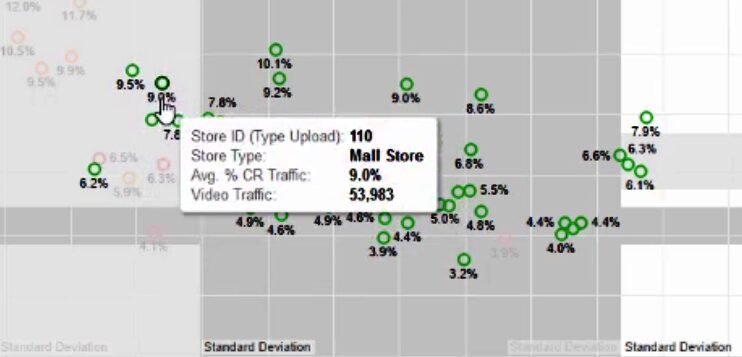
Here’s the step-by-step process to segment retail stores:
1. Define segmentation
How do you define a winning store?
Too many retailers tend to set arbitrary targets based on sales. But “sales” is a metric of financial outcomes. It does not describe store performance.
Another common bad habit is to use averages.
An average KPI is not actionable because you cannot identify winners and lagging stores.
Worse:
A common practice ranks stores from top-to-bottom in a linear list.
You create the context with sales opportunities and the local environment.
A better way is to segment stores.
2. Select Retail KPI
As KPIs, retailers often use Comp Sales, Inventory Turnover, and Average Order Value.
Sales Conversion is also a strong indicator of store performance.
But,
Store performance is a function of opportunity.
In a store, “Visitors” represents opportunity, and “Sales Conversion” measures performance.
I’d like to introduce you to the statistical method of Regression Analysis. The goal is to test how two variables influence each other.
For example,
There is a correlation between foot traffic and conversion rate.
The data tells us that stores with low foot traffic have high sales conversion rates. The opposite is also true. Stores with a high volume of visitors have a low conversion rate.
“Visitors” and “Sales Conversion” have an inverse correlation.
Why?
The answer is customer behaviors.
One possible explanation is smaller stores tend to be destination stores. It means visitors have a higher intent to buy.
In high-touch retailers, Service Intensity matters. When the rate of visitors to staff is lower, salespeople have more time to help each customer.
Also, there’s a diminishing return to adding staff and goods on sales.
The short version –
To compare stores using Sales Conversion, you must control for foot traffic.
3. Segment by Demand
Demand has a direct impact on store operations, inventory, and expenses. A store with 3,000 weekly visitors does not operate the same way as a store with 500 visitors.
Demand Bands work well because retailers have many store formats.
By narrowing the analysis to a Demand Band, you negate the impact of foot traffic on sales conversion.
4. Classify by Demographics
Geography is much more than a location. To better segment stores, you need consumer demographics.
Trade areas have characteristics such as:
- Household income for price sensitivity
- Cultural preferences for brands
- Rural or urban populations
- Tourist or local shoppers
- High or Low Competition
Next, we look at the stores themselves.

5. Sort by Store Type
Not all stores are alike.
For example,
Tesco has neighborhood grocers and supercenters. Nike has single-brand stores, local lifestyle stores, and Houses of Innovation flagships.
Here are sample categories:
Destination Stores: Big-Box are destination stores, for example, Walmart, Costco, and Aldi. In destination stores, the customer visits the store with a high intent to buy.
Standalone Stores: Stores located in High Street are usually standalone stores. Most are boutiques. Standalone stores tend to have the retailer’s highest Sales Conversion Rate.
Mall Stores: Shopping centers may be Tier-1 Malls, Lifestyle Malls, and Outdoor Malls. The location and position of the shopping center impact mall analytics.
Mall stores with one entrance: Many mall stores do not have the destination factor. They face the rigors of sales conversion and location analytics.
Mall stores with two or more entrances: When a mall store has a door to the parking lot, the foot traffic includes people passing by the mall. This behavior lowers conversions.
Now we start looking at the data.
6. Adjust by Period
When comparing stores, the periods create context.
For example,
- Week-over-week is for corporate managers because each day of the week has its quirks
- Day-by-Day is for store managers who need to connect local events to daily performance
- Year-over-year is for marketing managers who need to analyze the value of promotions
In Year-Over-Year reports, you should pay attention to data consistency.
Week #29 compares to the previous year’s week #29. But holidays, storms, and outlier events challenge the consistency of the comparison.
7. Adapt for Seasonality
Some retailers make over 50% of their annual revenue during the holiday season. Back-To-School sales used to start in Mid-August. Now they start on the last day of school. Alibaba made November 11 into a retail fantasy. Amazon followed with Prime Day.
Here’s the deal –
Retailers are always looking for a reason to entice customers to shop.
When we analyze store performance, we must consider these events. To compare year-over-year holidays and seasons, start at the end date and work backward.
For example,
Calendar: In 2008, Easter Sunday was on March 23. In 2019, the holiday was three weeks later, on April 12.
Trends: And a holiday can impact 2 to 6 weeks of revenue before the actual date. Also, much depends on the timing of marketing campaigns.
Brands: Holidays have different weights of importance. Some retailers generate half of their revenue during the Christmas Season. Jewelry stores thrive during Mother’s Day. Summer is essential for Garden Products. And Back to School is important for retailers selling school supplies and socks.
And you also need to care about the weather.
8. Exclude Outlier Events
Weather wreaks havoc on retailers.
And yet, outlier weather events are both a disaster and an opportunity.
In the blizzard of January 2011, stores in the Northeast lost 40% to 50% of traffic. Hurricane Andrew smashed through South Florida in 1992.
And yet, the retailers adapted.
In 2017, Hurricane Rita rammed through the Caribbean Islands. In South Florida, Home Depot had a plan for shipping supplies like generators and water. The local supermarket chain has contingency plans to open within hours after the storm passed.
Weather also distorts the year-over-year analysis.
In such outlier events, the retailers can adapt the reports to traffic trends or not. Either way, the data policy should be transparent.
9. Judge a Store against Itself
To align with corporate policies and goals, give the local stores access to data.
Because
Store comparison done wrong and you can destroy the store. But done right and you will increase store performance.
For example, start with a three months baseline.
It takes about a year to absorb the lessons from the data and develop expertise.
Most important,
Always judge a store against its self-improvement.
“The way you introduce a technology into the store is as important as the technology itself. – Anonymous VP Stores”.
You don’t need to be Amazon with Advanced Analytics.
Start simple.
Deploy people counting, segment, and compare stores.
Use comp sales, conversions, average tickets, service intensity, and foot traffic trends.
And have data-powered conversations with the stores.
Occupancy Counters: Real-Time Systems for Compliance, Safety & Store Operations
Occupancy counters are people counting sensors and systems. They generate data on how many people are present in real-time.
Occupancy is a calculated data output. The occupancy calculations could be of a physical or virtual location.
Live occupancy counters advertise the current state.
For example, you can display the occupancy metrics in a neon display in an airport or the entry to a retail store. You can also send text messages to employees. Also standard is an occupancy counter app for mall visitors.
Occupancy is a metric for location management. The benefits of real-time occupancy monitoring include compliance, safety, and operations.
For example, during the Covid-19 pandemic, real-time occupancy helped to watch social distancing.
What is real-time occupancy?
Real-time occupancy is an immediate output of foot traffic data. It is a calculated field of how many people are present.
What is occupancy monitoring?
Occupancy monitoring refers to systems that display real-time status. For example, messages include “the waiting time is 3 minutes” and “safe to enter the store.”
Choosing People Counting Sensors
People counting are binary technology systems. They detect an object, recognize it as a “person,” and add it to the count.
You choose people counting based on accuracy, cost, and benefits.
For example,
Accuracy challenges depend on technology. In camera-based sensors, the counts may include shadows. Thermal sensors will have challenges with high-density situations.
Costs are a factor of the system’s infrastructure. For example, 3D video analytics is too expensive to cover stores end-to-end.
The business benefit could be a simple but effective energy efficiency program. It could also be part of an advanced IoT platform.
In general,
The people counting systems could be smart sensors, mechanical gadgets, or embedded.
Let’s see what it means:
Smart counting sensors @ Edge
Smart sensors are standalone and accurate counting technologies. You often see smart sensors mounted above doors.
For example,
- Vision AI camera-based sensors
- 3D video analytics sensors
- Thermal imaging sensors
Embedded person counters
Embedded person counters mean part of a system. For example, the counters embed in a physical fixture such as a refrigerator or a door.
More examples are:
- Weight-based smart floor mats
- Infrared beams in security gates
- Mechanical counts in turnstiles
Foot traffic in tracking technologies
Today, foot traffic data is often an output of people-tracking technology. The tracking solution employs multiuse sensors such as cameras.
For example,
- Cameras, Vision in the cloud
- Wireless person trackers such as WiFi and GPS
- IoT platforms that include foot traffic in their analytical engines.
Most important,
The critical factor to choose a vendor is transparency.
Retail Location Analytics
Counting people is a category of people-tracking technologies and IoT solutions. In essence, the counting sensors detect “people”.
The counters emit foot traffic data of location, duration, and direction.
Location-based analytics includes site selection, path analytics, and in-store customer tracking.
