
Demand scheduling is the secret to calculating payroll hours for opportunities instead of sales outcomes. With a demand-based payroll schedule, you increase staff productivity and improve customer experience.
To understand how demand-driven schedules for retail stores work, the topics covered are:
- Avoid the self-fulfilling failures of scheduling employees to sales outcomes instead of store demand opportunities.
- With *Service Intensity*, you sync the payroll hours and staff schedules with the predicted foot traffic to the store. In other words, you design the schedule to demand KPIs.
- With *Service Success*, you measure local store activities against actual demand fluctuations. Effectively, you create a self-correcting mechanism for a demand-based schedule.
Demand-driven scheduling improves workforce management in retail stores.
Most importantly,
Scheduling to demand improves employee satisfaction and customer experience.
Here’s why:
Avoid the Self-Fulfilling Failure of Calculating Payroll Hours to Sales Outcomes Instead of Demand
The standard method for designing store staff schedules is to adapt them to the point-of-sale data. In other words, you align the store’s resource allocations—such as payroll hours (schedule), products, and operations—with sales outcomes.
Sounds good?
Well, it’s not.
By aligning resources to outcomes, not opportunities, you are cementing the store in a less-than-desired state of stagnation and, maybe, even worse, a downward spiral of decay.
For example,
Below is the tale of the stores’ Hello and Goodbye:
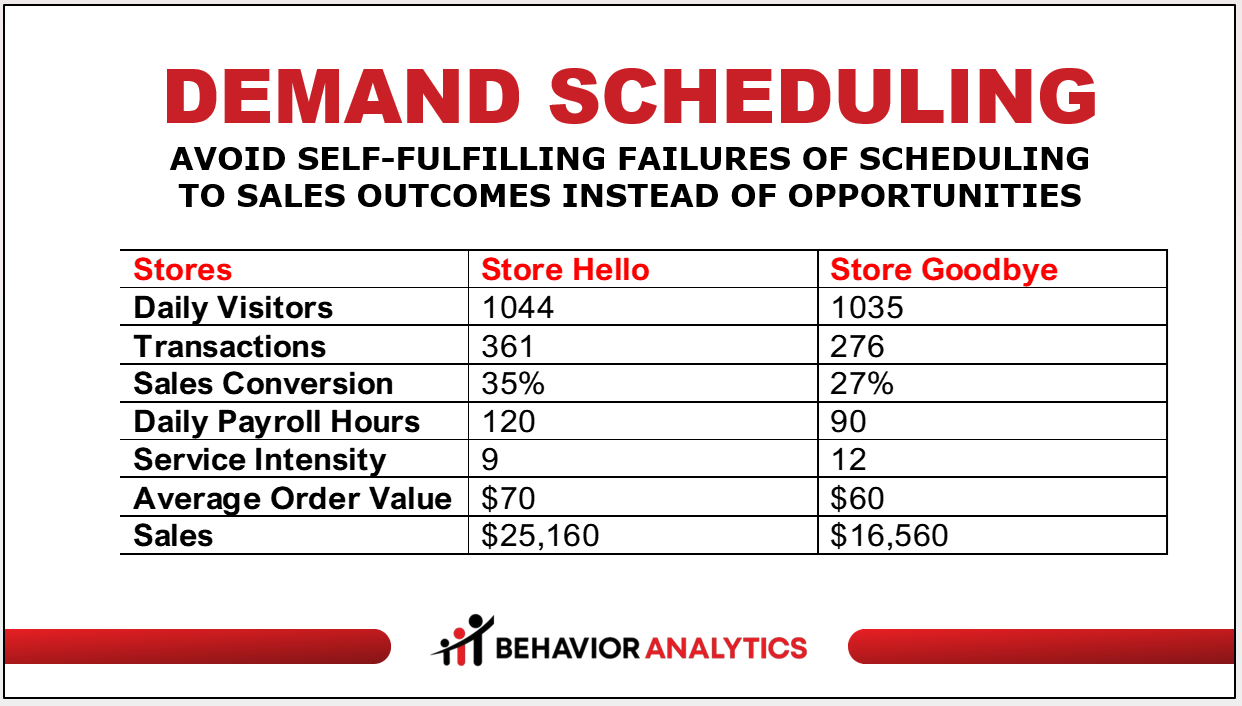
Hello and Goodbye belong to the Special Chain and sell apparel and accessories.
Both stores are situated in shopping malls, serve similar trade markets and demographics, and are within a 20-minute drive of each other. The two stores face similar demand opportunities.
If you only had point-of-sale data, the results would be evident—with $25,160, Hello has almost doubled the daily sales of the Goodbye store, which were $16,560.
If you only had sales data, the number of transactions (people who purchased) and Average Order Value would be higher in the Hallo store than in Goodbye.
For the Special Chain, the relative success of the Hello store compared to Goodbye has direct implications for allocating merchandise, payroll, and compensation.
Most importantly, it had a direct impact on the store schedule. Hello had 120 daily payroll hours, while Goodbye had 90. The Workforce Management System assumed that since store Hello sells more than Goodbye, it calculated and allocated it more payroll hours.
Once you add customer demand (foot traffic) data…
WOW.
It is very, very clear that the Hello and Goodbye stores have the same demand opportunities.
If the retail chain has physical stores with similar locations, demographics, geography, and store layouts, the traffic data indicates they face similar customer demand and should perform at the same level.
The data offers clues.
For example,
Sales Conversion in the Goodbye store is significantly lower than in Hello, at 27% compared to 35%. This means the Goodbye store does not convert as many visitors to buyers as it should.
Why?
The Special Chain corporate office probably does not allocate merchandise to the less successful Goodbye store. In addition, the Goodbye store has only 90 daily payroll hours compared to 120 staff hours in the Hello store.
Easy Fix!
The story of the Hello and Goodbye stores was published in the original textbook of Behavior Analytics in Retail (2013). It is based on a true story.
The senior retail executive said to the team, “We did this to ourselves.”
What is Demand Scheduling in Retail Stores?
Demand scheduling allocates store staff payroll hours based on forecasting the number of people visiting the store and the retailer’s operating policies.
You start with Store Visitors.
Traditional payroll planning is based forecasted sales. A demand-driven schedule revolves around forecasted demand. It ensures that the calculation of the store payroll aligns with foot traffic patterns.
For example,
Demand Scheduling Benefits
- Customer Satisfaction: Meet the requirements of operating the store, including task management, stocked shelves, and checkout services. The on-site staffing aligns with in-real-time demand.
- Customer Service: Design schedules so the store staff can serve customers according to the retailer’s customer service policies. In other words, you deploy Rapid Respose techniques.
- Employee Productivity: Schedule employees based on their qualifications and ensure they are positioned where they most impact store performance. Task priority depends on actual demand.
- Payroll Optimization: Avoid the expense of overscheduling and idle time while avoiding underscheduling, which can lead to failing to meet operational requirements.
- Employee Satisfaction: Prevent Staff Turnover expenses and morale burnouts to create a more responsive and agile retail environment.
To understand the relationship between the number of staff and the number of shoppers (demand) in the store and inside a virtual zone, you use these metrics:
Demand Scheduling Metrics
Service Intensity is the ratio of customers to staff by location and time frame. The metric provides a guideline for how many associates must be on site to comply with a Customer Service model.
Service Target is the specific goal or objective of customer service that the retail organization sets. For example, the Service Target is often 18 to 25 ratios for Big Box and 3 to 7 ratios for specialty stores.
Service Occupancy is the customer-to-staff ratio in a specific in-store virtual zone or department. While Service Intensity is calculated using Foot Traffic Arrivals, Service Occupancy is calculated by counting the number of people staying in a zone for a time frame.
In other words, the demand opportunity for the store is measured with foot traffic. The demand factor for a virtual zone is the number of store visitors staying there. Store Occupancy is a metric often used with Rapid Response techniques.
Service Density refers to the concentration of people within the zone, such as the number of people per square foot. Service Density is often used with other time-based metrics to evaluate customer service interactions and quality.
Service Success is the percentage of successful service events out of all events. It is also known as Service Level Ratio, Service Level Measurement, or Success Rate. In other words, it monitors the success of a service policy in the local stores.
Remember,
Store Optimizers care about scheduling in the context of Rapid Response (Being in the Right Place at the Right Time).
In other words, the local store schedule is designed from the bottom up based on the retail chain requirements and local demand fluctuations.
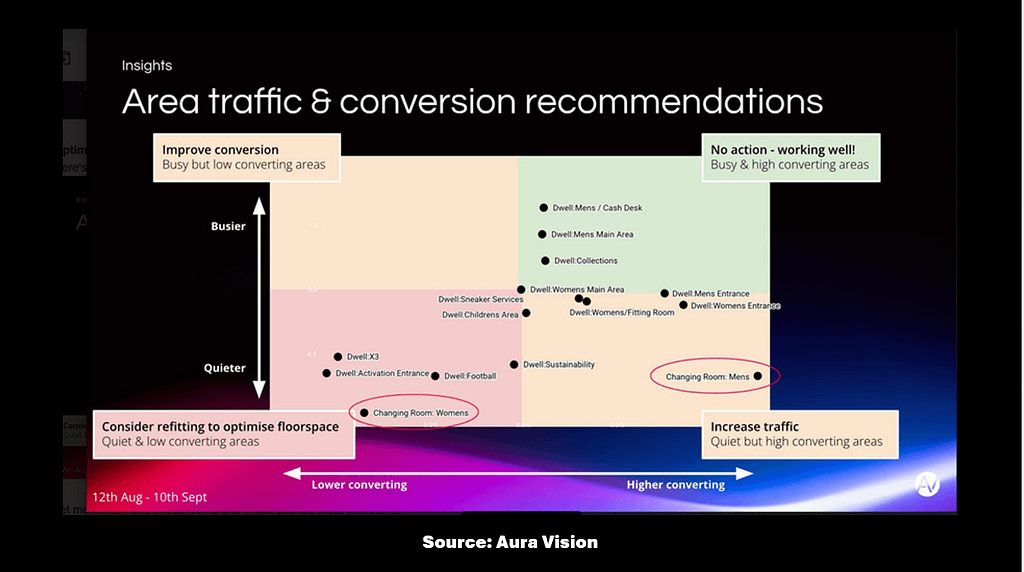
Here’s an example of demand scheduling benefits from Aura Vision:
How to build a demand-driven schedule?
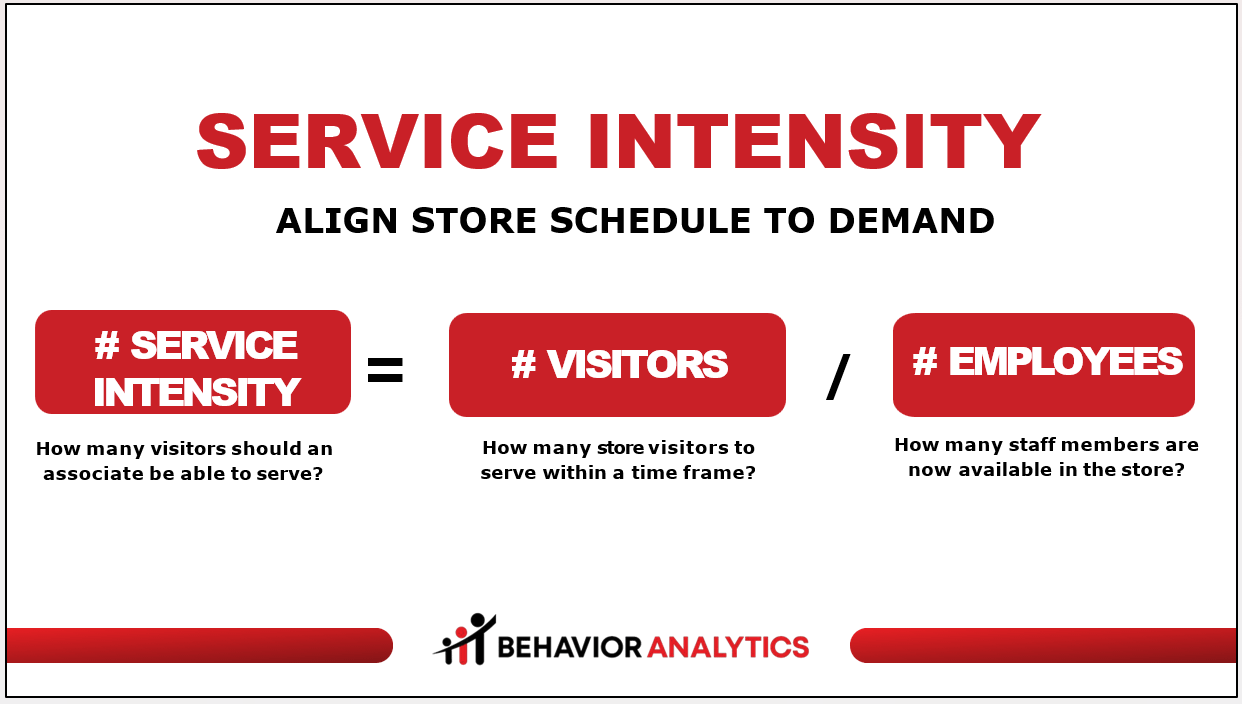
You start with Service Intensity.
Service Intensity KPI: Calculating Store Payroll Hours to Align with Demand-Driven Traffic Forecast
What is the purpose of having staff in the store?
If your answer is store operations, you are not alone. Many retailers view employees as payroll costs, an expense dedicated to performing tasks. Sometimes, associates hold sales jobs. The store is often considered a tactical sales floor.
This is why many retailers describe Service Intensity as a staff-to-customers ratio.
Yet,
Service Intensity is a robust Key Performance Indicator (KPI) for understanding service-to-demand scenarios.
Service Intensity is the ratio of customers to staff by location and by time frame. The metric provides a guideline on how many store associates are required to accommodate a Customer Service model.
For example,
Imagine a sportswear retailer with ten staff members available to assist customers on the floor. In an hour, the store had 270 visitors (demand). The calculated Service Intensity is 27 (270/10 = 27).
In other words, each staff member is available to help 27 shoppers.
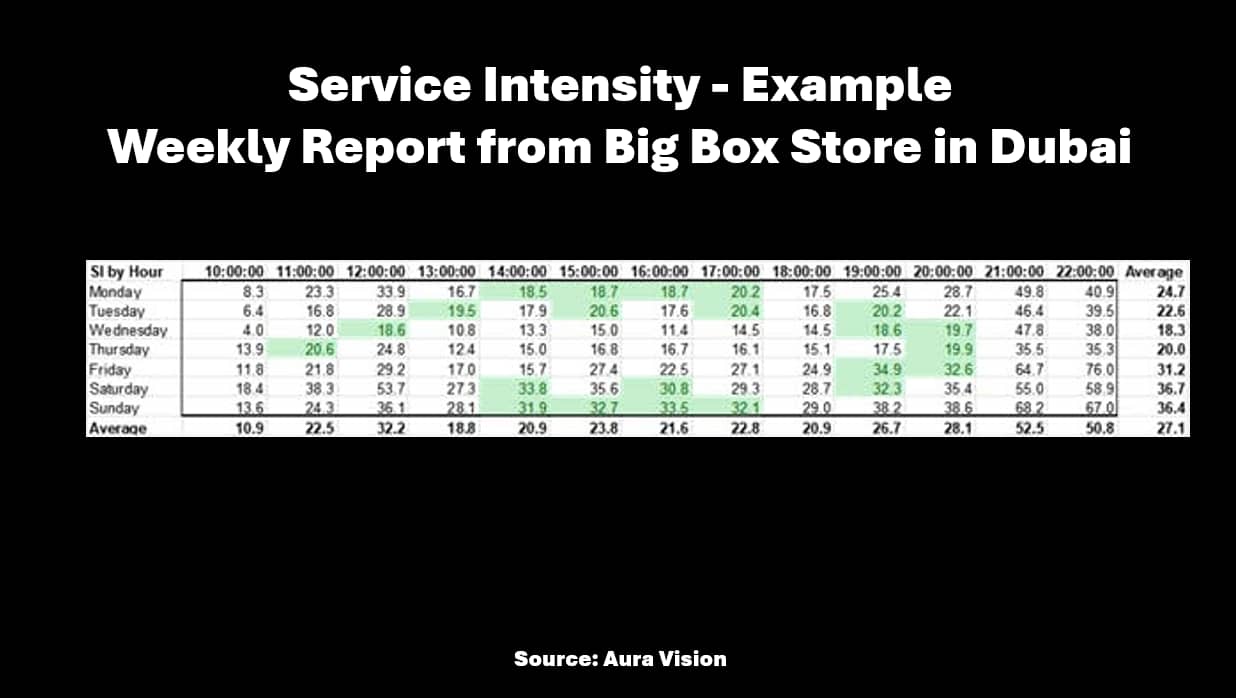
Here’s an example of a weekly report with the Service Intensity Rate by Hour from Aura Vision:
Taking it further,
A visual chart of the Service Intensity data from a Dubai store offers a quick insight into the relationship between demand and staff payroll.
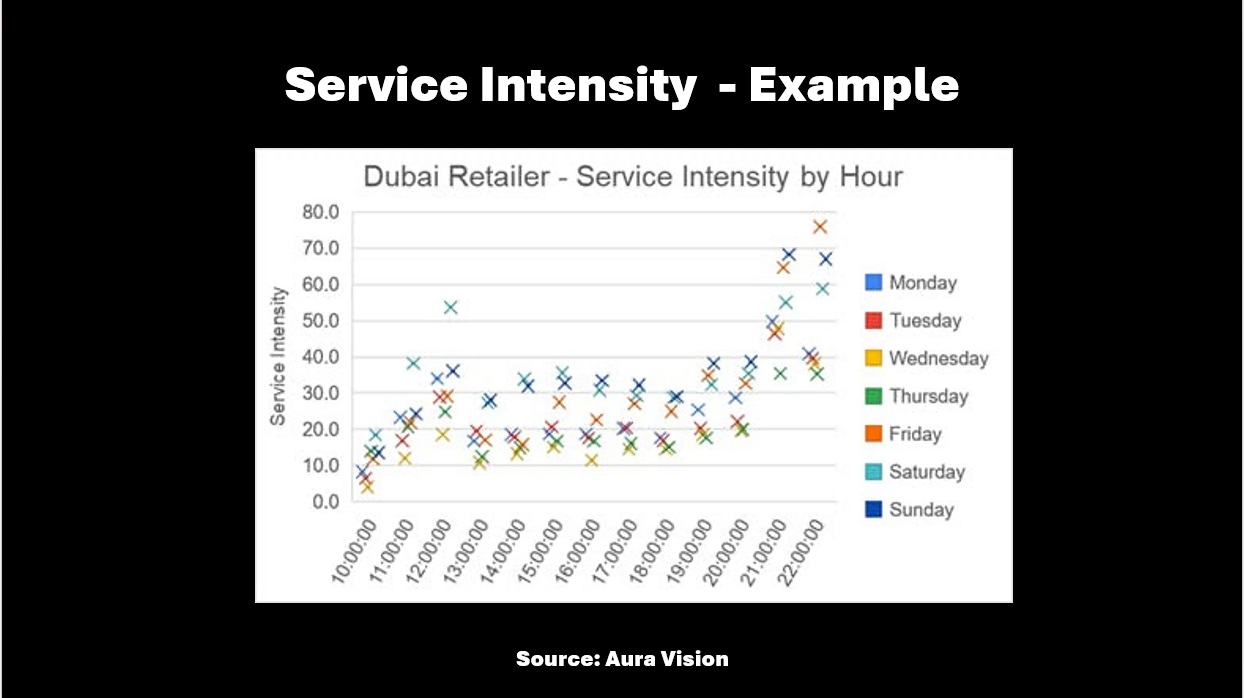
The chart shows a large influx of visitors to the store after 9 pm on Friday, Saturday, and Sunday, yet the staff schedule is not aligned with the rising traffic demand.
The demand data fits cultural norms in the Middle East, where people like to shop on weekends and during the evening hours.
How to Calculate Service Intensity
Like any calculated metric, Service Intensity’s numeric value depends on how you define the variables.
For example,
- Visitors: You can define demand to the store by metrics such as Arrivals (the number of people entering the store), or in-store such as Occupancy (the number of people inside the store).
- Employees: You can count staff by calculating payroll hours or by people counting solutions. You can count all employees in the store or limit it to those associates stationed on the floor.
- Period: It is essential to define the time frame for calculating Service Intensity, such as Service Intensity Ratio per hour, day, or weekly average range.
As you become familiar with Service Intensity, you can adapt the metric as necessary.
For example,
Weighted Service Intensity differentiates between employees. For example, a temporary staff member will be counted as 0.5 instead of 1.
In summary,
The Benefits of the Optimal Service Intensity
Discovering and implementing Optimal Service Intensity will improve Sales Conversions, ensure efficient store operations, and enhance the customer’s experience.
For example,
- When scheduled ratio of on-site staff to store visitors is optimal, shoppers receive prompt attention, assistance, and personalized service as defined by the Customer Service Model.
- When associates can actively assist shoppers and offer product knowledge, the customers are more likely to purchase. Demand scheduling increases Sales Conversions.
- When the workload is balanced to the changes in customer demand, the on-site staff can better function in service events and operational responsibilities.
- Overstaffing can lead to idle employees while understaffing results in overwhelmed staff and dissatisfied customers. An optimal schedule creates an inviting shopping environment.
- Control labor costs by calculating payroll hours to adjust staffing levels to actual demand (foot traffic patterns) without compromising service quality.
Here’s another example of Demand Scheduling courtesy of Aura Vision:
Demand Scheduling Example (Case Study by Aura Vision)
This example of Demand Scheduling from Aura Vision focuses on aligning the store schedule and payroll hours to increasing sales conversions.
Aura Vision used historical data and trends to predict peak hours and busy periods. With better foot traffic forecasting, you should schedule more staff during these times to handle increased demand.
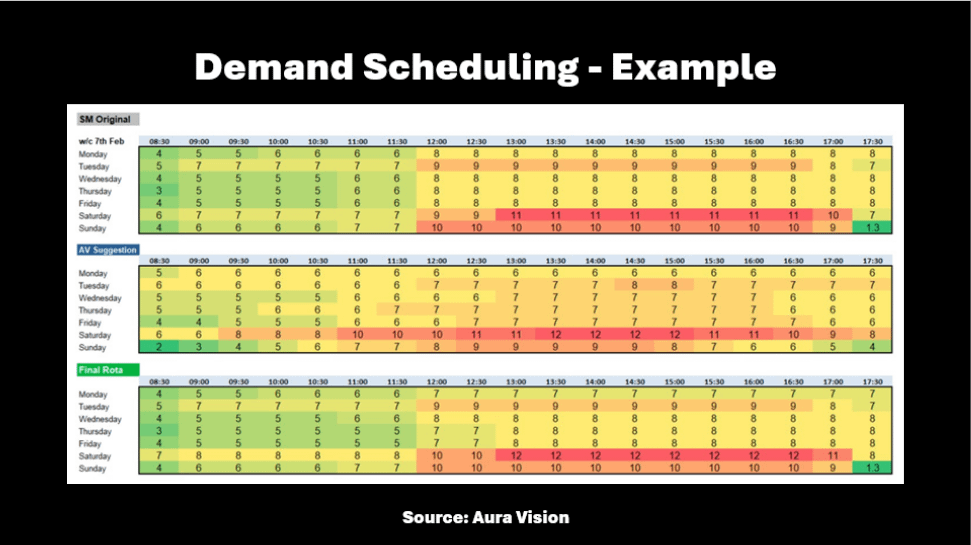
After aligning the schedule with the recommendations from Aura Vision, the stores’ conversion rates improved compared to the control stores.
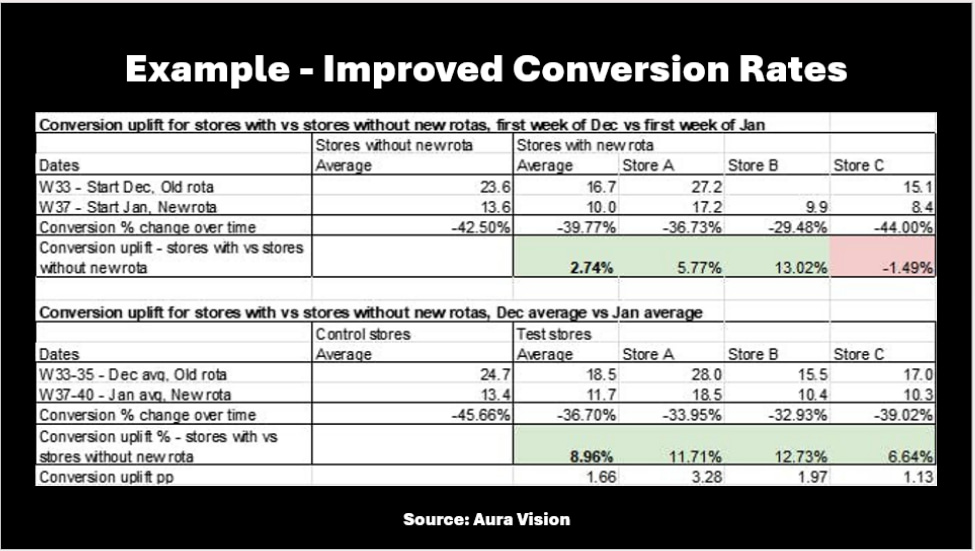
The question is why.
Why does demand scheduling work?
Why does a demand-driven schedule impact the store sales conversion rate?
Service Success KPI: Measure the Outcome of Demand Scheduling
There is a connection between what employees do—serving shoppers, stocking products, and performing tasks—and achieving an excellent customer experience.
For example,
Employees are the backbone store operations in the back room and checkout. Task Management is often measured with Compliance Rates.
Store employees also serve as salespeople. A product will not shoot out for attention, but interacting with an associate will shift the shopper’s attention and increase the intent to buy. In this case, retailers often use Sales Conversion Rates and Revenue to measure a successful outcome.
Yet, Service Success Rates helps to understand customer service as a demand-driven holistic event.
Service Success Rates represent the percentage of successful events.
Service Intensity and Optimal Service Time are metrics that guide how local stores should perform. The Service Success Rate measures the actual activities.
Let’s dig deeper.
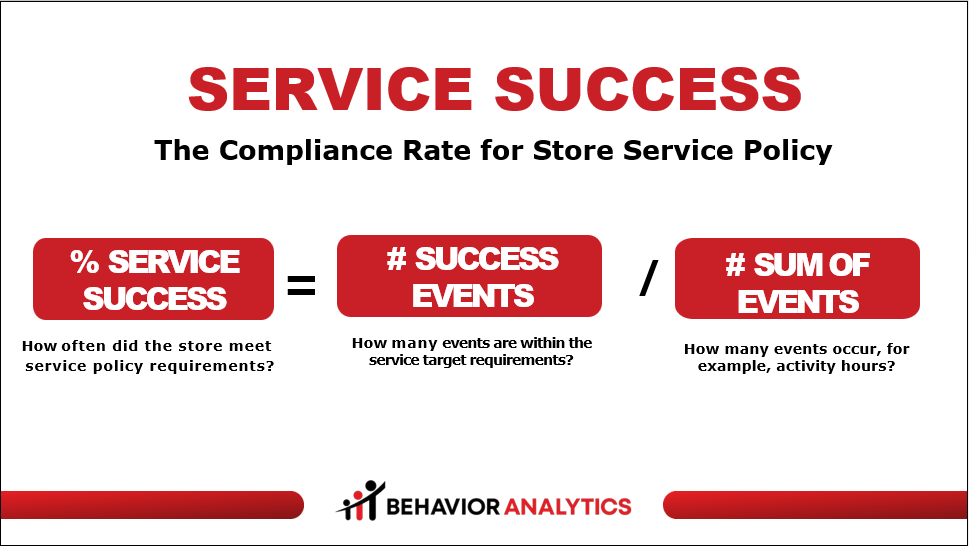
The Service Success Rate, also known as the Service Level Ratio or Service Level Measurement, is the percentage of successful service events out of all demand-based events.
Specifically:
- # Success Events count the events where the store achieved the Service Target.
- # Sum Events count all the demand events in the evaluation period.
- % Service Success reflects how often the store meets the service guidelines.
For example,
Let’s revisit the Aura Vision case study to see how the Service Success Rate works.
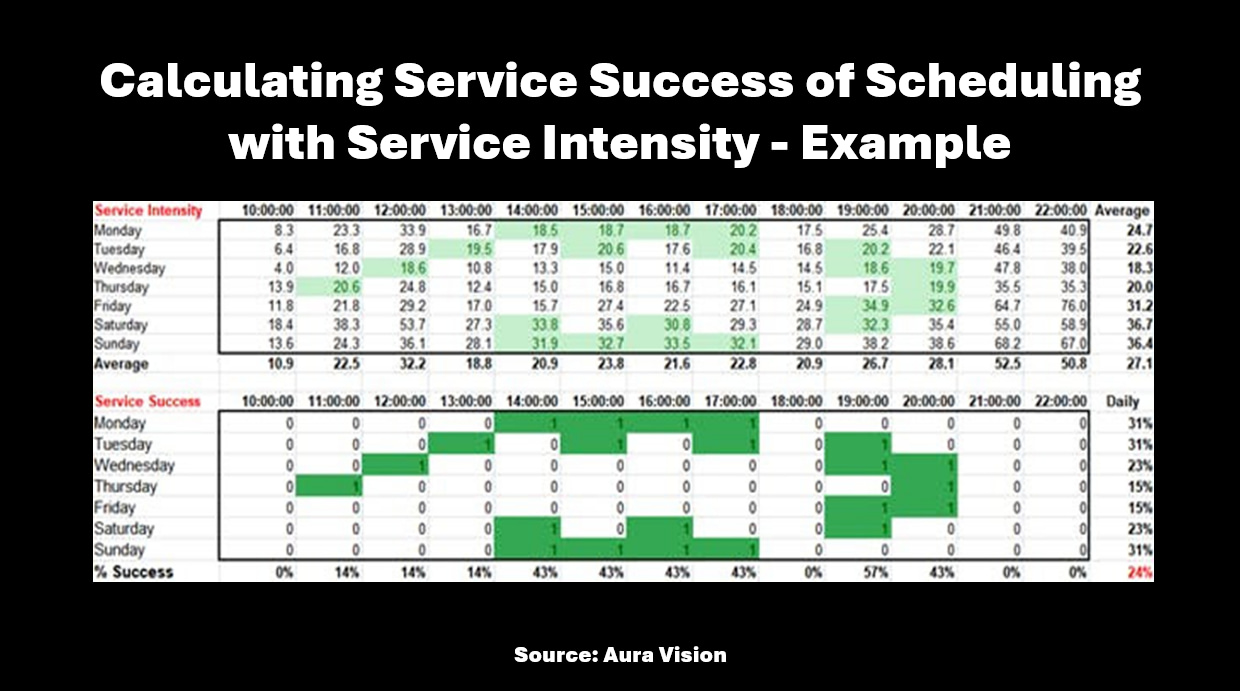
The top table shows that this store has 91 activity hours.
Let’s assume the retailer defined the Service Intensity Targets as 18 to 22 on Mondays to Thursdays and 30 to 35 on Fridays, Saturdays, and Sundays.
In other words,
On weekdays, the associates can do more in influencing sales in the flagship sports store in Dubai.
A schedule designed with lower Service Intensity means that an associate deals with less shoppers (lower demand). In practice, that will be reflected in the checkout, stocking, and service events.
The service intensity ratio is higher on weekends because the store is busy. That is not an uncommon scheduling policy. Adding sales associates tends to diminish marginal productivity.
Social proof also plays a more significant role in influencing sales when the store is crowded. In other words, an increased demand has its own influencing factors on the shopping environment.
The definition of Service Intensity Targets varies depending on the retailer, store type, and store staff job descriptions and tasks.
For simplicity’s sake, the store’s employees are on-site and available for whatever job is required.
Next step,
If the Service Intensity Target is achieved during the event, you count the event as 1. If not, you label it as 0.
In this example,
The store met the Service Intensity Target requirements from Monday to Thursday at 13 hours out of 52. The Service Level is 25% (13/52)
On Friday, Saturday, and Sunday, the Service Intensity Target was achieved 9 hours out of 39, or 23%.
The Service Success Rate for the week is 24% (22 hours out of 91 activity hours).
In other words,
The local store met the retailer’s staff-to-customer requirements at 24% of the activity hours.
Tracking the Service Success Rates is often an eye-opening exercise for retailers. It allows for deeper conversations about what is happening in the store and what can be done to improve sales and customer satisfaction.
Demand Scheduling for Store Optimizers
Demand Scheduling is a continuous process that aligns local environments with corporate policies.
Below are examples of Service Targets:
- “One in Front” for Queue Management based people waiting in line.
- “Wait less than 3 Minutes” for time-based customer service.
- Greeting visitors in less than 60 seconds after entering the store.
- Optimal Service Time of 90 to 360 seconds.
- Queue Flow of exiting the queue in 180 seconds or less.
Effectively,
Every demand-based event can be considered a call to action with a conversion rate that store optimizers can design as an in-store experiment.
Moreover,
Advanced Store Optimizers can run in-store experiments to identify which influencing factors impact the desired behavior.
For example,
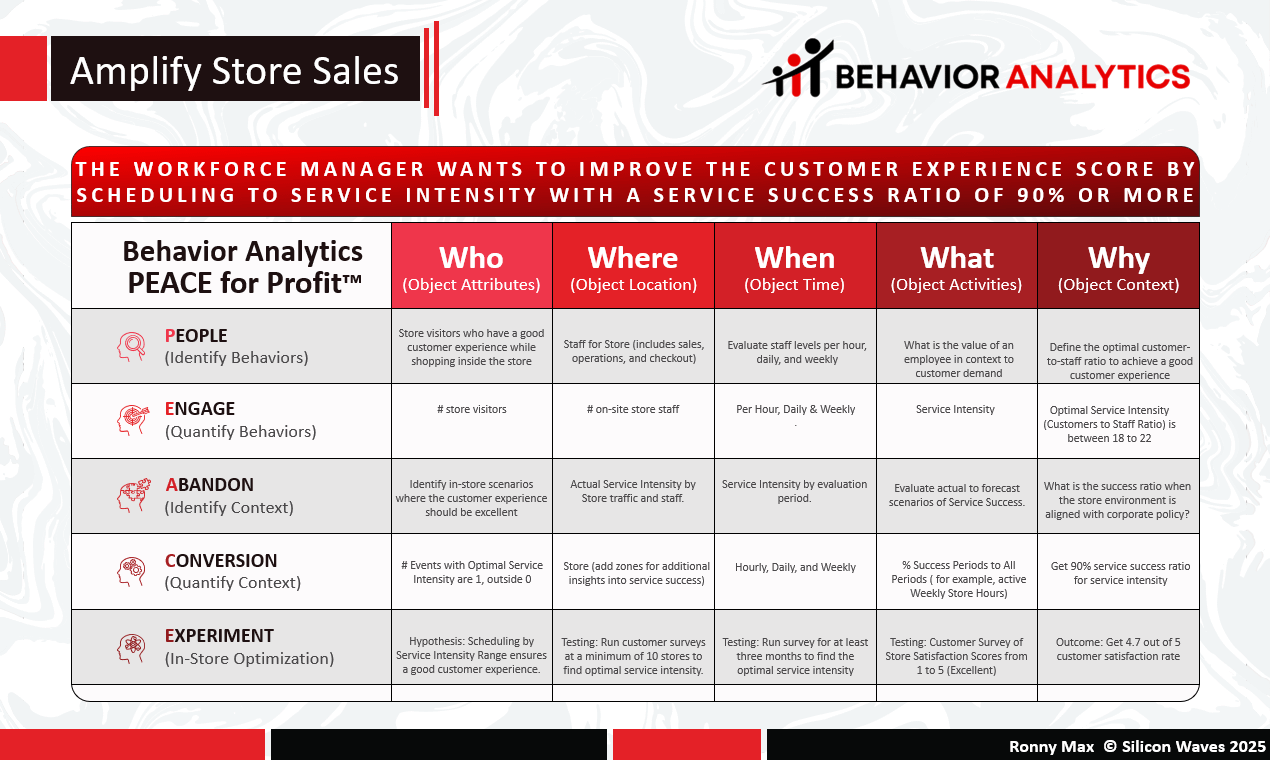
A Workforce Manager wants to improve the Customer Satisfaction Scores by scheduling to an Optimal Service Intensity with a Service Success Ratio of 90%.
| Awesome! |